
Welcome to our Home Page, a tutorial for learning the role of space science and technology in monitoring Earth's surface and atmosphere, sponsored by the Applied Information Science Branch (Code 935) at NASA's Goddard Space Flight Center. As you work through these pages, you will see how we apply remote sensing (a term defined at the beginning of the Introduction Section) to studying the land, sea, and air that comprise out planet's environments. Not only will you gain insight into past uses of aerial photography and space imagery, but you should develop skills in interpreting these visual displays and data sets by direct inspection and by computer processing.
This latest version of the Tutorial has a new and powerful instructional feature: most sections will include a series of questions inserted within relevant parts of the text. These are designed to stimulate one's learning experience by being challenged to answer thought questions, to solve using mathematics problems that rely on equations, to carry out practical exercises requiring interpretations of imagery, to make lists, or to record your general comments or opinions. A question is identified by being italicized in blue and at its beginning by a marker label such as I-3 or 13-8. Unlike most textbooks that have questions at the end of a chapter, but fail to provide answers, this Tutorial is closed modeled after the writer's (N.M. Short) earlier Landsat Tutorial Workbook which had (often subjective) answers to the many questions it contained in an Appendix. Thus, in this Tutorial the student/user can try his/her mind on reaching plausible answers or conducting calculations and then by clicking on the blue wording be directed to an answer sheet (each section has its own single page sheet). Once on the answer sheet, to return to the page containing the question, just click on your browser's Back button. If you did reasonably well, the correspondence to this stock answer will give you confidence that you have acquired and can use the information pertinent to the question; if your answer seems "off" with respect to the one I have provided (assuming I am more or less "right") then you will still learn by having tried, attained some level of understanding, and then having been guided to an appropriate measure of the "truth" in the answer provided. Most questions or exercise activities will require your brain as the only tool, but some exercises will involve examining specific images. You can either work directly from your screen or can print out the image/picture when this Tutorial is converted to a PDF mode (check the Whats New button above for updates on that status). A magnifying glass may help in some pictorial instances. Some questions have a geographic flavor: keep a U.S. Atlas and a World Atlas handy.
There will normally be 10 to 40+ questions
per section but the Overview has only a half dozen. Lets introduce you to the
type of questions to expect by asking this one.
 |
With this first insight in mind, consider this: Normally, we experience our world from a more or less horizontal viewpoint while living on its surface. But, under these conditions our view is usually limited to areas of a few square miles at most owing to obstructions such as buildings, trees, and topography. The total area encompassed in our vistas is considerably enlarged if we peer downward from, say, a tall building or a mountain top. This increases even more - to perhaps hundreds of square miles - as we gaze outwards from an airliner cruising above 30000 feet. From a vertical or high oblique perspective, our impression of the surface below is notably different than when we scan our surroundings from a point on that surface. We then see the multitude of surface features as they would appear on a thematic map in their appropriate spatial and contextual relationships. This, in a nutshell, is why remote sensing is most often practiced from platforms such as airplanes and spacecraft with onboard sensors that survey and analyze these features over extended areas from above, unencumbered by the immediate proximity of the neighborhood. It is the practical, orderly, and cost-effective way of maintaining and updating information about the world around us.
 |
Remote sensing uses instruments or sensors to view the spectral and spatial relations of observable objects and materials at a distance, typically from above them.
We emphasize that remote sensing systems of various kinds are the most widely used tools for gathering information about Earth, the planets, and the stars. In other words, remote sensing lies at the heart or efforts by NASA and the Russian space agency, as well as programs by other nations (mainly, Canada, France, Germany, Italy, India, China, Japan, and Brazil) to explore space, from our terrestrial surface to the farthest galaxies.
Remote sensing began in the 1840s as balloonists took pictures of the ground using the newly invented photo-camera. Perhaps the most novel platform at the end of the last century was the famed pigeon fleet that operated in Europe.
 |
Aerial photography became a valuable reconnaissance tool during the First World War and came fully into its own during the Second World War. The logical entry of remote sensors into space began with automated photo-camera systems mounted on captured German V-2 rockets, launched out of White Sands, NM. With the launch of Sputnik in 1957, putting film cameras on orbiting spacecraft became possible. The first cosmonauts and astronauts used hand-held cameras to document selected regions and targets of opportunity as they orbited the globe. Sensors tuned to obtain black and white TV-like images of Earth flew on meteorological satellites in the 1960s. Other sensors on those satellites made soundings or measurements of atmospheric properties at various heights.
 |
As an operational system for collecting information about Earth on a repetitive schedule, remote sensing matured in the 1970s, when instruments flew on Skylab (and later, the Space Shuttle) and on Landsat, the first satellite dedicated to mapping natural and cultural resources on land and ocean surfaces. A radar imaging system was the main sensor on Seasat, launched in June, 1978. In the 1980s, a variety of specialized sensors - Coastal Zone Color Scanner (CZCS), Heat Capacity Mapping Mission (HCMM), and Advanced Very High Resolution Radiometer (AVHRR) among others - orbited primarily as research or feasibility programs. The first non-military radar system was JPL's Shuttle Imaging Radar (SIR-A) on the Space Shuttle in 1982. Other nations soon followed with remote sensors that provided similar or distinctly different capabilities. By the 1980s, Landsat had been privatized and a widespread commercial use of remote sensing had taken root in the U.S., France, Russia, Japan and other nations. Much of this growth was, and is still being, driven by the increasing awareness that Earth's environments are in peril from man's activities and misuses.
 |
To whet your appetite for remote sensing, we now present one of the typical early Landsat images that started the interest in using satellites to monitor Earth's surface. (You should also look more carefully at the image background for the logo title at the top of the Coverpage you accessed through Start. That scene shows an October 1972 Landsat 1 [ called ERTS-1 at the time] panorama of California's Central Valley, the Coast Ranges, and the San Francisco and Monterey Bay areas.) The scene below is a Landsat 1 view of north-central Utah taken just 15 days after launch (August 7, 1972). The right side of the image is bright red, which is the normal color for thick forests and grasslands as rendered in a false color image in which we associate red with healthy vegetation that is very bright in the near-infrared (see the Introduction Section for the explanation of color response and assignment). The red areas on the right coincide with the high Wasatch Mountains that run east of the
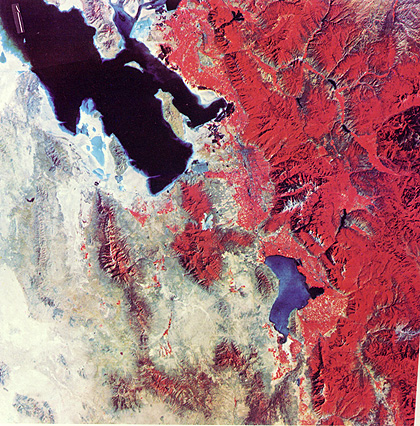
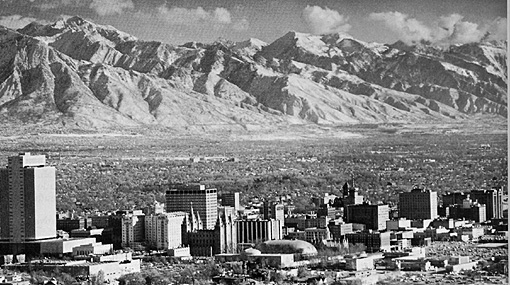
block-fault mountains and deserts (gray-tan tones) of western Utah. Other reds in small patches mark the farmlands of the desert plains whose potential inspired Brigham Young to settle his group in this "promised land". The Great Salt Lake occupies part of the upper scene (if you look carefully, you may see a slight tonal difference along a straight, sharp boundary; this is due to a cutoff of water circulation by the Union Pacific railroad causeway). Lake Utah (bluer because of silt) is to its south. We challenge you to find the metropolitan area of Salt Lake City in this image. This image, of course, is a vertical view. To acquaint you with looking at Earth this way, we added a near-horizontal aerial view of the city and the Wasatch Front to its east. Try to relate this oblique perspective with its appearance from Landsat.
 |
This tutorial draws upon Landsat, SPOT (Systeme Probatoire d'Observational de la Terre) and several radar systems for most of its examples of common space imagery. We introduce some other space systems, designed for remote sensing, in various sections of the tutorial. We list here the principal ones flown by the U.S. and other nations (identified in parentheses) along with their intitial launch date.
Group 1 - Primarily Land Observers: Landsat (1-6) (1973); Seasat (1978); HCMM (1978); SPOT (France) (1-3) (1986); RESURS (Russia) (1985); IRS(1A-1D) (India) (1986); ERS (1-2) (1991); JERS (1-2) (Japan) (1992); Radarsat (Canada) (1995); ADEOS (Japan) (1996) (Note 1: SIR-A (1981), (Note: SIR-A (1981), SIR-B (1984), and SIR-C (1994) are radar systems flown on Space Shuttles; a Laser Altimeter also flew on Shuttle)(Note also: many of the meteorological satellites produce lower resolution images of the land that have proved useful)
Group 2 - Primarily Meteorological Observers: TIROS (1-9) (1960); Nimbus (1-7) (1964); ESSA (1-9) (1966); ATS(g) (1-3) (1966); DMSP series I (1966); the Russian Kosmos (1968) and Meteor series (1969); ITOS series (1970); SMS(g) (1975); GOES(g) series (1975); NOAA (1-5) (1976); DMSP series 2 (1976); GMS series (Japan) 9 (1977); Meteosat(g) series (Europe) (1978); TIROS-N series (1978); Bhaskura (India) (1979); NOAA (6-14) (1982); Insat (1983); ERBS (1984); MOS (Japan) (1987); UARS (1991); TRMM (U.S./Japan) (1997)(Note 1: g = geostationary) (Note 2: Nimbus also observed general land formations; e.g., Nimbus 6 carried SCMR, an experimental sensor designed to obtain information on surface composition)
Group 3 - Major use in Oceanography: Seasat (1978); Nimbus 7 (1978) included the CZCS, the Coastal Zone Color Scanner that measures chlorophyll concentration in seawater; Topex-Poseidon (1992); SeaWiFS (1997)
(Note: NSCAT, the NASA Scatterometer, developed at JPL and launched in 1996 by a Japanese rocket, was designed mainly for oceanographic studies but has provided valuable information applicable to meteorology and land observations.)
This impressive list convinces us that remote sensing has become a major technological and scientific tool for monitoring planetary surfaces and atmospheres. In fact, the budgetary expenditures on observing Earth and other planets, since the the space program began, now exceed $150 billion. Much of this money has been directed towards practical applications, largely focused on environmental and natural resource management. The Table below, put together in 1981 by the writer, summarizes the principal uses in six disciplines.
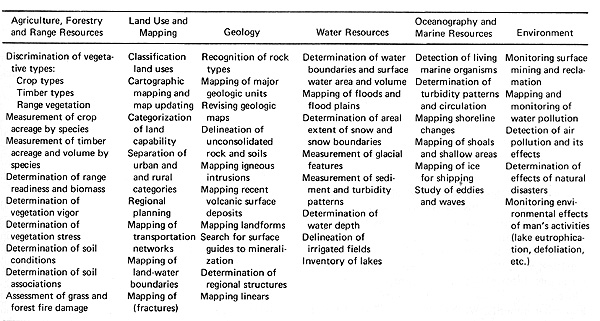
All of these applications are valid today, and many others have been devised and tested, some of which we introduce in other sections of this tutorial. The literature on remote sensing theory, instrumentation, and applications is now vast, including a number of journals and reports of numerous conferences and meetings. The great improvements in computer-based image processing, especially personal computers that handle large amounts of remote sensing data, have made robotic and manned platform observations accessible to universities, resource-responsible agencies, small environmental companies, and even individuals. Geographic Information Systems (GIS) provide an exceptional means for integrating timely remote sensing data with other spatial types of data. The GIS approach stores, integrates, and analyzes information that has a practical value in many fields concerned with decision-making in resource management, environmental control, and site development.
The need for monitoring systems that map changing land use, search for and protect natural resources, and track interactions within the biosphere, atmosphere, hydrosphere, and geosphere has become a paramount concern to managers, politicians, and the general citizenry in developed and developing nations. This need has led to a mammoth international program to use a variety of technologies, centered on observation systems from space, to improve our ability to oversee and regulate the systems that govern Earth's effective operations. Among names associated with this concept are the International Geosphere and Biosphere Program, the Global Change Program, Earth System Science, Mission to Planet Earth (MTPE), and the Earth Observing System (EOS). These programs will last well into the first decade of the 21st Century. Starting in 1998, several major platforms launched with broad compliments of sensors supported by continuing operation of current sensor systems. These programs will have far-reaching impact on nations and at least indirect effect on all people on our planet, as they address problems and concerns tied to the environment and to resources. When coupled and integrated with other major data management and decision making approaches, GIS, MTPE, and EOS should evolve into highly efficient implements for continuous gathering and processing of key elements of knowledge required to administer the complex interactions between nature and human endeavors.
The Internet is a prime source for information on almost every aspect of remote sensing. Several sites offer good overviews of satellite remote sensing. One that has recently appeared, and provides an excellent synopsis of the main principles and applications, has been constructed by the Canadian Center for Remote Sensing. Click here if you want to view it now, or at your leisure.
If you want a preview of how some scientists apply remote sensing to monitor manlind's influence on the environment, then go to the Home Page recently added to the Internet by the Consortium for International Earth Science Information Network. Another online source of basic information about remote sensing is this author's still relevant, 1982 NASA Publication RP 1078: The LANDSAT TUTORIAL WORKBOOK. Other prime sources for illustrations and fundamentals are this author's MISSION TO PLANET EARTH: LANDSAT VIEWS THE WORLD (co-authored with Paul D. Lowman, Jr, Stanley C. Freden, and William C. Finch, Jr), THE HCMM ANTHOLOGY, NASA SP-465, and (co-authored with Robert Blair, Jr) GEOMORPHOLOGY FROM SPACE, NASA SP-486. For those who wish to learn even more, we invite you to look into the Home Page for the Remote Sensing Core Curriculum project which highlights a new educational approach now under development. Also, here is a list of seven well-known textbooks that detail most of the fundamentals and applications of Earth Remote Sensing:
The primary purpose of this Web Site Tutorial and its CD-ROM counterpart, then, is to inform remote-sensing professionals and the general public about the principles and achievements of remote sensing, with emphasis on demonstrated applications. Another key is to point to the anticipated functions and benefits of the ESE initiatives. As a secondary but, nevertheless, important goal, we intend for the Tutorial to be a learning resource for college students, as well as individuals who require indoctrination in the basics of space-centered remote sensing in support of various organizations, such as the Regional Application Centers. Some of these people include associates who assist in providing input information into day-to-day operations. Thirdly, we hope that this survey of Satellite Remote Sensing will attract and inspire a few individuals from the world community who might consider a career in this field or in the broader fields allied with Earth System Science (ESS) and the Environment. For those who wish to learn even more about these fields before they are covered in Section 16, we invite you to look now into the homepage of the Universities Science Research Association (USRA) which highlights a new educational approach based on ESS.
Here is our list of topics to accomplish these objectives, providing a comprehensive survey of remote sensing and its many ramifications.
Foreword
Overview of this Remote Sensing Tutorial
Introduction to Remote Sensing: Historical and Technical Perspectives
Section:
1. Image Processing and Interpretation: Morro Bay, California
2. Geologic Applications: Stratigraphy; Structure; Landforms
3. Vegetation Applications: Agriculture; Forestry; Ecology
4. Urban and Land Use Applications
5. Mineral and Oil Resource Exploration:
6. Flight Across the United States: Boston to San Francisco
7. Regional Studies: Use of Mosaics from Landsat
8. Radar and Microwave Remote Sensing
9. The Warm Earth: Thermal Remote Sensing
10. Aerial Photography as Primary and Ancillary Data Sources
11. The Earth's Surface in 3-Dimensions: Stereo Systems and Topographic Mapping
12. The Human Remote Senser in Space: Astronaut Photography
13. Collecting Data at the Surface: Ground Truth; Hyperspectral Remote Sensing
14. The Water Planet: Meteorological, Oceanographic and Hydrologic Remote Sensing
15. Geographic Information Systems: The GIS Approach to Decision Making
16. Earth Systems Science; Mission to Planet Earth and the EOS Program
17. Use of Remote Sensing in Basic Science Studies I: Mega-Geomorphology
18. Basic Science Studies II: Impact Cratering
19. Planetary Remote Sensing: The Exploration of Extraterrestrial Bodies
20. Remote Sensing into the 21st Century; The Commercialization of this Technology
Appendix A: Cosmology
Appendix B: Interactive Image Processing
Appendix C: Principal Components Analysis
Appendix D: Glossary
Unlike a formal course in the subject, with chapters covering principles, techniques and applications in a pedagogic and systematic way, we lead you through a series of sections focused on one or more relevant topics. Because we can represent most remote sensing data as visuals, we will our treatment around illustrations , such as space images, classifications, maps, and plots, rather than numerical data sets. Although these data sets are the real knowledge base for application scientists in putting this information to practical use. (Some of this material has been acquired by direct downloading off the Internet. We are grateful to the source organizations and individuals.) Descriptions and discussions accompany these illustrations to aid in interpreting the visual concepts. "Standard" space images, particularly those from Landsat sensors, are usually the focal points of a section, but we frequently add special computer processed renditions with ground photos that depict features in a scene and descriptive maps where appropriate.
We also embed numerous links to other remote sensing sources and to various continuing or planned programs. Some of these programs are federal or international programs such as MTPE, whereas, others are programs from educational or commercial organizations that provide training and services. These links, in turn, have their own sets of links, which, as you explore them, will broaden your acquaintance with the many facets of remote sensing and its popular applications.
We have a couple of caveats: this tutorial is using thumbnails for the larger images due to the fact that the tuturial is image- and graphics-intensive. Unless you are on a T-line, cable, ISDN or some other broadband link, you may have to wait 5+ minutes to download the larger images on many pages. You may wish to turn off or defer these images and receive text only. In some instances, we provide automatic enlargements of certain images those surrounded by a blue border by clicking within. The images quality may vary in tone or color balance, and resolution depending on your monitor and graphics card combination and other factors. Thus, what we describe in the text, you may not easily see from the screen renditions. Whenever feasible, we wrap descriptive text around smaller images to facilitate comparing textual pointers with the illustration. For certain graphics, such as locator maps, you may want to print a copy to refer to, rather than jump back and forth within a page or to different pages when the text references graphics that are out of view.
The tutorial begins with an introduction, which covers the principles of physics (especially electromagnetic radiation) underlying remote sensing, then considers the main kinds of observing platforms, and closes with the history of satellite systems, with a focus on Landsat. Many of the subsequent sections and topics center on Landsat because it continues to be a kingpin among the current remote sensing systems. Although satellites concerned with meteorological and oceanographic/hydrologic phenomena constitute the largest number of Earth-observing platforms by far, we consider them primarily in Section 14. In some instances, scenes taken by Metsat sensors over land, where we see prominemt surface or environmental features we include in other sections.
The first section is one of the longest in this tutorial because we try to introduce most of the major concepts of image analysis and interpretation by walking through the product types and processing outputs in common use. Perusal through the Introduction and Sections 1, 8 and 9 is the minimum effort we suggest if you want the basics. Click on the What's New button at the beginning of this Overview to keep abreast of changes and schedules for additions.
We especially call your attention to Section 19 - Planetary Remote Sensing. While this topic seemingly strays from the main tutorial theme Remote Sensing of Earth it offers a comprehensive summary of the main achievements in the exploration of our Solar System. This exploration was the centerpiece of the U.S. and Russian space programs and relied heavily on remote sensing techniques. The review in Section 19 of these accomplishments shows what we learned about these fascinating other worlds (planets, satellites, and asteroids), along with an embedded survey (as an optional link) that considers some basic ideas of astronomy and cosmology. But, beware: the section is quite long and has more than 140 graphics (mostly images), some online, and others accessible by linking.
In keeping with scientific convention and the intended worldwide use of this tutorial, we normally specify measurements in metric system units (si), especially those for the electromagnetic spectrum and other units in physics. We will place English unit equivalents in parentheses where appropriate or to clarify, particularly when dealing with geographic parameters.
We close this overview with a presumption that you may want to learn about the background of the two principal architects of this home page. If not, you may move on to the Table of Contents.
PostScript: This tutorial
is the outgrowth of a suggestion by Nicholas M. Short, Jr., who, at the time
was a computer scientist at Goddard's Code 935 (the sponsor). He conceived the
idea in part as an alternative source of information on remote sensing to the
Landsat Tutorial Workbook (now out-of-print) for which requests continued
over the years to funnel through him, as a consequence of his name recognition
(and confusion). Collaborators: Code 935
NASA GSFC, GST, USAF
Academy Webmaster: Bill Dickinson Jr.

Primary Author: Nicholas M. Short, Sr.
email: nmshort@epix.net
Contributor Information
Last Updated: September '99
Site Curator: Nannette Fekete
Please direct any comments to rstweb@gst.com.