
Views of Earth from space have provided mankind with new insights into the nature of our world, an appreciation of its place within the Solar System, and a fuller comprehension of the marvelous complexity of our planetary surface. As a result, Earth science is on the verge of a revolution in geomorphologic research. Over the last two decades, new technologies born from the space program have generated a rapidly expanding volume of geomorphic information. Specifically, observations from orbital satellites and manned orbital and space flights have given scientists a synoptic view of Earth previously impossible to obtain. It is now feasible to observe and study repetitively large-area land features up to continental dimensions through the medium of spaceborne imagery. Pictures at various scales, taken by remote sensors that utilize spectral bands in the visible, infrared, and microwave (radar) ranges, have opened new realms for quantitative geomorphological investigation. Moreover, we can now analyze the Earth from the planetary perspective. In this new context, Earth becomes just one of a number of celestial bodies of varying size and composition in the Solar System, some of which have their own distinct geomorphic character. The space images and other photographs presented in this book amply illustrate the value of observing the Earth´s geomorphology from the same global vantage point that has successfully revealed the landscapes of other Earth-like planets.
In the latter part of the 19th century and the first decades of the 20th century, some early geomorphologists (e.g., G. K. Gilbert, 1877; W. M. Davis, 1899; W. Penck, 1924; N. Fenneman, 1938; J. T. Hack, 1960) extended their investigation of the Earth´s land surface to megalevels. Thus, a global framework often underlay their postulates and theories on the formation and development of the Earth's varied landscapes. Their ideas dominated geomorphic research and contributed much to the advancement of knowledge concerning the systematic characteristics of the Earth´s land surfaces. In the 1950s and 1960s, the emphasis in geomorphological research shifted toward more quantitative and replicable investigations in which accurate measurements of features and processes were made in order to reinforce general theories and their implications. As a result, the emphasis in geomorphology evolved toward micro-geomorphology, focusing on the quantitative evaluation of elements of small landform features accessible to the investigator in the field. Although high-resolution aerial photography was often used as a tool in these investigations, it was seldom the principal vehicle in any study.
| Figure 12.1. Rift Valley in the East Pacific Rise near 13°N, obtained during a dive of the CYANA submersible (CYANA in 1972); courtesy of R. Hekinian. |  |
|---|
Beginning in the late 1950s, a series of quantum leaps both in available technology and in the understanding of terrestrial surfaces have fostered a new outlook in geomorphology. These advances pointed toward the need for a renewed emphasis on the mega (i.e., global) approach to studies of the Earth´s landscapes. Prompted by research goals during the International Geophysical Year, by 1959 marine scientists had revolutionized the understanding of the ocean floor. Their discoveries led to the realization that the ocean floor was a varied complex of landform systems dominated by volcanic and sedimentary/erosional processes. The ocean floor, making up more than 70 percent of the planetary surface, has become an enlarging area of geomorphological interest, especially in the last 15 years. New technology now makes possible ever closer scrutiny of the varied geomorphic features of the ocean floor (Figure 12-1). In the 1960s, photographs taken by orbiting astronauts, culminating in the startling views of the full Earth from the Moon, have made us aware of the value of viewing our own planet from space. Since 1972, when Landsat-1 (ERTS-1) was launched, there has been a constantly growing supply of pictures with improving resolution, in a number of spectral bands, covering nearly all the land areas of the Earth. The recent developments in radar imaging, through Seasat and Shuttle Imaging Radar (SIR-A, SIR-B), as well as advanced airborne systems such as MARS (Gelnett and Gardner, 1979), supplement the geomorphic data base with images in the microwave range, some showing regions seldom covered by Landsat due to persistent cloud cover (e.g., Amazon Basin; New Guinea). Other systems, including the recently tested Large-Format Camera (LFC) and some still to be tried (e.g., Shuttle laser altimeter), promise more geomorphic information in the near future.
To date, geomorphologists have made relatively limited use of satellite data that offer the global overview provided by spaceborne imagery. There are, for instance, no published studies that attempt to reexamine and confirm or refute, using the synoptic view from space, the older theories of landscape evolution derived from the early qualitative studies. The most extensive use of geomorphology from the perspective of space has been by planetary geologists. These specialists apply geomorphic principles in interpreting and mapping planetary surfaces and in developing theories of landscape evolution for the Moon, Mars, Mercury, Venus, and some of the moons of Jupiter and Saturn solely from space images (Glass, 1982; Short, 1975). Planetary geologists have taken this approach out of necessity. Although a small amount of in-situ surface data has been obtained for a few local areas of the Moon, Mars, and Venus, the hostility of the surface environments on those bodies to human life precludes extensive manned surface investigations in the foreseeable future. This has forced greater reliance on unmanned and orbital surveillance of these surfaces. The techniques developed for such exploration can also be profitably applied to terrestrial landforms. The advent of this new space and oceanographic technology, particularly the imaging systems, means that a mega-geomorphological investigation of the Earth is possible and amply justified.
MEGA-GEOMORPHOLOGY
In March 1981, at a conference sponsored by the British Geomorphological Research Group, geomorphologists coined the term "mega-geomorphology" (Gardner and Scoging, 1983) to describe the study of landforms and landscapes from subcontinental to global scales; by implication, the space perspective is desirable but not always necessary. The primary thrust of this conference was the regional distribution of landforms, especially in relation to those processes that formed them. Four years later, in January 1985, 30 geomorphologists from the United States, Great Britain, and Australia gathered for a workshop held at a conference center outside Tucson, Arizona, by invitation of NASA and the International Union of Geological Sciences. The objectives were to review the nature of global mega-geomorphology and to consider its present status and future place within the scientific study of landforms (Hayden, 1985). The workshop participants represented a broad range of specialties including glacial geology, marine geology, coastal studies, eolian processes, landscape evolution, fluvial processes, tectonic geomorphology, resource exploration, physical geography, remote sensing, and planetary geology. From the deliberations of the Tucson Workshop participants, it was soon evident that, despite the wide diversity of specialties, there was a complementary range of interests. Participants felt they were witnessing the beginnings of a "New Global Geomorphology built on expanded scales of concern in both space and time" (Baker and Head, 1985). They concluded that mega-geomorphology has now come into focus: "first, because geomorphology has recently been presented with exciting new techniques, most notably the rapidly developing technology of remote sensing. Second, these tools have arrived at a time when geomorphology is reassessing its role by defining or rediscovering important research thrusts. Third, geomorphologists are increasingly leaving their specialty niches to pursue broad interdisciplinary concerns with tectonic, paleoclimatic, and even extraterrestrial ramifications" (Baker and Head, 1985).
STUDIES OF THE EARTH FROM SPACE
Landform investigations at continental scales require a regional outlook that can best be provided by images with viewing areas of tens to hundreds of kilometers on a side. In addition, the availability of multispectral images and temporal coverage at a variety of scales broadens the research by providing multiple data sets for analysis. Few studies have taken advantage of the mammoth amount of image data available. Those that do strongly demonstrate the potential of space imagery in geomorphological investigations.
Breed and Grow (1979) and Breed et al. (1979) relied on Landsat imagery to classify global sand seas. Dunes in major desert regions of the world were classified according to their external shape and slipface orientations as noted from Landsat imagery, Skylab, and aerial photographs. The types of dunes thus classified are, in order of global abundance, linear, crescentic, star, parabolic, and dome. Walker has carried forward this study of deserts and their associated sand seas in Chapter 8 of this volume.
| Figure 12.2. A NOAA AVHRR nighttime thermal image (October 19, 1977) of much of North and South Dakota and part of the southern Canadian Great Plains. The Missouri River roughly divides the left and right sides of the image. Lakes Manitoba and Winnipeg are in the upper right corner. Note more dissected plains terrain west of the Missouri River, with the image equivalent to approcimately 900 km. |  |
|---|
Molnar and Tapponnier (1977) applied the synoptic views obtainable from Landsat imagery to the interpretation of the Himalayan and associated mountain ranges in the Tibetan plateaus of India and China (Plate T-48). They demonstrated that strike-slip faulting is pervasive throughout Tibet and southwestern China and might account for the suggested 2000-km northward movement of India into Eurasia during the last 40 million years. The key to putting this interpretation together was the ability to "see" the region from the vantage of space.
Brosse and Scanvic (1976) investigated the Villefranche-de-Rouergue zone in the southwestern portion of the Massif Central of France, using a variety of imagery obtained from satellites, stratospheric balloons, and aircraft at different scales and different spectral bands. Satellite imagery at a scale of 1:1 000 000 revealed a large regional ring structure within the Villefranche granite. Drawing on progressively larger scale imagery, Brosse and Scanvic mapped the orientation and distribution of fracture systems that are virtually unrecognizable on the ground owing to a lack of outcrops.
Lowman et al. (1986) used Landsat imagery (Plate T-15) to study fractures on the Canadian Shield in a test of the regmatic shear hypothesis, which suggests that the Earth´s crust is fractured by a regular system of orthogonal shears resulting from global stress conditions early in the Earth's history. The results of the study, which included field investigation of some of the mapped fractures, demonstrated that the fracture patterns do not convincingly confirm the regmatic fracture hypothesis. They also found evidence in the patterns to suggest detachment and rotation of different regions of the shield at various times during the Precambrian.
| Figure 12.3. GLORIA sonogram of the Taney Seamount west of the California Coast (Courtesy of J.V. Gardner, USGS). |  |
|---|
Another recent study, involving Seasat Radar imagery (SAR), was published by John Ford (1984). It concentrated on the identification and classification of drumlins in Ireland (Plate G-19), as well as an examination of flow patterns in valley glaciers in Alaska. Ford was able to measure effectively the width/length ratios of drumlins. From this, he classified the drumlin fields into four categories: (1) subcircular hills, (2) broad ovoid drumlins, (3) long ovoid drumlins, and (4) ridges. The higher spatial resolution of the SAR (25 m compared to 79 m for Landsat) provided detail not visible on Landsat. Seasat imagery of Alaskan valley glaciers displayed medial moraines and variations of ice-surface roughness due to supraglacial till. This enabled Ford to decipher the flow patterns and flow history of glaciers such as the Columbia Glacier. Ford observed that repetitive radar imaging coverage facilitates a time-lapse record and would permit regional monitoring of glacial movements. RADARSAT, a Canadian system scheduled for launch in 1992, hopes to take advantage of this fact.
Robinove (1978) and Baker (1983) utilized repetitive coverage of specific regions from Landsat to demonstrate the usefulness of the imagery in evaluating catastrophic floods like that which occurred in the Coopers Creek drainage of Queensland and South Australia on February 6, 1974. A comparison of before and after images indicated that the floodplain in places was 60 km in width (Plate F-15). A similar study was applied to the Mississippi River flood of March 1973 by Morrison and White (1976).
Schneider et al. (1979) employed enhanced nighttime thermal infrared imagery from the Advanced Very High Resolution Radiometer (AVHRR) on NOAA polar-orbiting satellites to map drainage patterns and landforms over large areas at a spatial resolution of about 0.9 km. A geometrically corrected, computer-enhanced AVHRR image of North and South Dakota and the surrounding area obtained on the night of October 19, 1977, provides an excellent large-area portrait of the landforms and drainage of the region (Figure 12-2). The AVHRR detects transient surface thermal patterns, so that images obtained at another time of the year (e.g., wet versus dry seasons) might be quite different.
The Selima Sand Sheet in the southwestern desert near the border between Egypt and Sudan is a vast flat sand-covered region. Landsat views of the area disclose nothing unique about the region. Field observations also exposed little more than a flat featureless desert. However, in 1981, the SIR-A (Shuttle Imaging Radar) imagery indicated buried geomorphic detail never before seen (Plate I-3). The radar signal (23-cm wavelength) penetrated through 1 meter or more of overlying dry sand to reveal an ancient drainage network trending to the southwest toward Lake Chad that must have rivaled the modern Nile in its discharge characteristics (McCauley et al., 1982). Recognition of the subsurface drainage was largely contingent on the presence of buried materials such as caliche nodules, having higher dielectric properties than dry sand, that mark the edges of the channels.
| Figure 12.4GLORIA long-range side-scan sonograph mosaic showing meandering distaributary channels on the Amazon deep-sea fan (Lamont-Doherty Geological Observatory of Columbia University). |  |
|---|
In September of 1983, during Space Shuttle mission STS-8, astronauts photographed a massive dust storm over northwestern Argentina (Francis and Rashka, 1983). Eolian particles, derived from fine-grained continental red beds and gypsum salt flats (salars) in the southern Puna, produced red and white dust plumes that could be traced hundreds of kilometers downwind. Documentation of these dust storms has confirmed the hypothesis that much of the landscape in this region is of eolian origin. It also identified the probable source of the loess that mantles the Argentine Pampas and demonstrated that the silt accumulation is an ongoing process (Bloom, 1985).
Detailed studies of the geomorphic features of the ocean floor at synoptic scales are only just commencing as oceanographers and marine geologists develop new technologies appropriate to operation in a marine environment. The recent development of narrow-beam echo-sounding equipment coupled with computer-controlled swath-mapping systems and the development of high-resolution deep-towed side-scan sonar such as GLORIA (Geological Long Range Inclined Asdic) and SeaMARC I and II (Sea Mapping and Remote Characterization) hold forth the promise of a rapid increase in accurate and detailed knowledge of the deep ocean floor (Bryan, 1985).
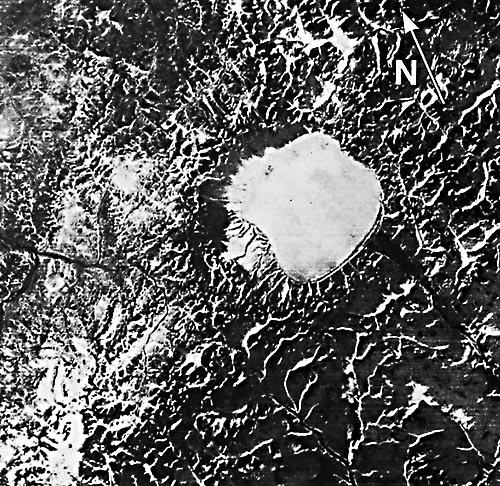
Between 1969 and 1980, the British Institute of Oceanographic Sciences obtained sonograms of more than 1 percent of the ocean floor using GLORIA, a long-range side-scan sonar instrument operated in much the same way as a spaceborne radar imaging system (Laughton, 1980). High-quality acoustic backscatter pictures were secured from a variety of terrains on both the continental shelf and the deep ocean floor. Recognition of numerous volcanic features, such as the Taney Seamount west of California (Figure 12-3), has been possible with such systems.
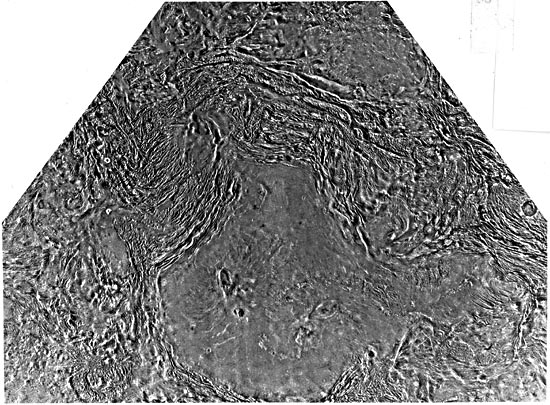
Damuth et al. (1983, 1985) used GLORIA to investigate the Amazon deep-sea fan on the continental rise off the coast of northeastern Brazil. They discovered a complex of meandering channels, levees, and oxbows comparable in size and appearance to those of mature fluvial systems on land (Figure 12-4). Development of such a complex would seem to require conditions similar to those found in meandering fluvial systems on land, including a relatively continuous high-volume flow of sediment through the channels. This is contrary to the traditional view that deep-sea fan features result from intermittent turbidity flows.
| Figure 12.5. SeaMARC I sonogram of the South Wilmington and North Heyes submarine canyons east of New Jersey (courtesy of B. McGgregor, USGS). | 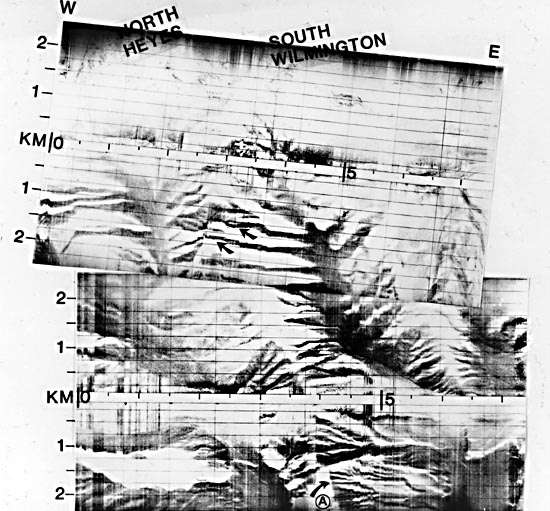 |
|---|
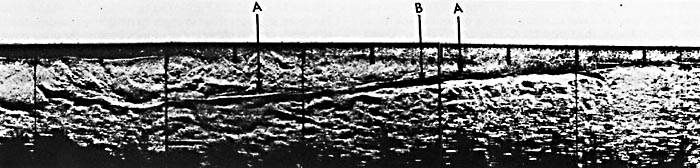
SeaMARC is a combination side-scan sonar and bathymetric mapping system. It provides the means to construct ocean floor images at 10-m resolution and 10-km swath width (Blackinton and Hussong, 1983). Using images from SeaMARC I, McGregor and Lockwood (1985) mapped the extensively gullied South Wilmington submarine canyon and other features of the continental slope east of New Jersey (Figure 12-5). Hussong and Fryer (1983) combined SeaMARC II images into a photomosaic of a chain of submarine volcanoes in the northern Mariana island arc, deriving from this a bathymetric map with a contour interval of 100 m. They synthesized a consistent geologic interpretation based on integrated information from the mosaic and the bathymetric map. The SeaMARC technology has the potential not only for imaging the ocean floor but also for the analysis of the processes acting to form the observed features. Another important contribution to global submarine geomorphology was the demonstration by Marsh et al. (1985) that variations in ocean surface topography mapped from high-resolution Seasat altimeter data are expressions of gravitational differences related to sea-bottom morphology and hence tend to mirror most of the major seafloor landforms and topographic features such as mid-ocean ridges (Figure 12-6).
QUANTITATIVE GEOMORPHOLOGY FROM SPACE
The regional analysis of the Earth´s surface by overhead observations came into its own with the routine acquisition after World War II of aerial photography-especially effective when quality aerial photomosaics were end products (see Figure T-2.2 for an example). From the vantage of space, astronauts and cosmonauts, during early orbital missions, took photographs of ground scenes that covered significant parts, or even all, of physiographic provinces. Unmanned Earth-observing satellites have given us almost complete visual coverage of the terrestrial surface in image format at scales and resolutions that permit them to supplement, or even substitute for, aerial and space photography. This large-area coverage offers new approaches to interpreting the evolution of landscape by integrating collections of landforms, rather than individual ones, seen in context with one another and with the various processes acting over a broad region. However, the main uses of both aerial and space imagery have been limited thus far to getting a "mental picture" of the landscape as an overview and as aids in making geologic and other types of maps describing and classifying the underlying geologic units, their structural states, and their topographic expression. Specifically, in geomorphology, most quantitative measurements from aerial photographs have been directed toward drainage network definition, determination of slopes and other geometric parameters, and change detection resulting from certain dynamic processes (e.g., shifting sand seas). Rather surprisingly, quantitative geomorphic analysis of assemblages of landforms seen advantageously in space imagery has not yet come into its own- a conclusion reached from any literature survey of results from the Landsat, Seasat, and other satellite or airborne sensor systems developed for terrestrial observations, and strongly inferred in several working group summaries at the Tucson Workshop.
| Figure 12.6. Surface topography of the world from Seasat Radar, imaging the underlying morphology of ther seafloor (courtesy of J. Marsh, Goddard Space Flight Center, NASA). | 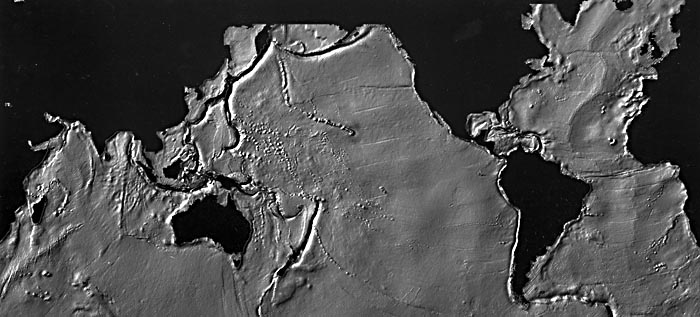 |
|---|
As implied in the opening section, and aptly summarized by B. Lucchitta (1983, p. 1905), regional geomorphic analysis from space, incorporating quantitative measures as a prime method for both data gathering and information extraction, has been far more extensively applied to geological investigations of other planetary bodies. Most such planetary exploration begins with observations of a planet´s surface, sometimes initially through a telescope, and eventually from orbiters with imaging instruments. As in the case with Landsat, the most obvious surface features first perceived by any interpreter of planetary imagery are landforms and related geomorphic phenomena. Using the method of comparative planetology, those landforms that seemingly have terrestrial counterparts are identified and analyzed. This allows deductions concerning processes that acted to develop them to be drawn. Maps of the planetary surfaces are produced by photointerpretive techniques; these maps tend to be a mix of landform types and stratigraphic units whose sequential relations and relative ages are assessed by principles of superposition and crosscutting (especially on planets where the effects of impact cratering remain dominant) and by crater (frequency) counts. Fields of view, scales, and resolutions for the surface images are similar in range to those acquired from Earth-observing satellites. A variety of sophisticated mensuration techniques has evolved over the years to extract quantitative data needed to improve our understanding of the nature, origin, and history of planetary bodies. This mode of planetary investigation has assumed great importance because, in nearly all cases, the chance to significantly increase the scope of knowledge through traditional ground studies (particularly with rock sampling) has of necessity been very restricted (even the manned and unmanned excursions on the lunar surface have touched only a tiny fraction of the Moon's surface). Thus, quantitative geomorphology as applied to large areas has taken a vital role in extraterrestrial exploration; the ability to conduct onsite field studies over most of the Earth´s land areas has probably impaired the application of quantitative techniques to space imagery simply because measurements can usually be made by other means (notwithstanding the fact that some measurements can be carried out more rapidly and inexpensively on the space products).
At this point, a definition of quantitative geomorphology is in order. In an excellent review paper on "Development of Quantitative Geomorphology" for the Centennial Special Volume 1 published in 1985 by the Geological Society of America, Marie Morisawa defines this subfield of geomorphology as "the application of mathematics and statistical techniques to the study of landforms, their description and the processes by which they are created and changed. It includes also the application of physical and chemical theories to the analysis of landscapes." Morisawa further states that measurements by themselves do not constitute a quantitative study. Rigorous statistical treatment of data, scaled-down analog modeling, computer simulations, and systems analysis procedures can enter into the quantitative treatment of a geomorphic problem. Quantification of landform characteristics by means of morphometry has become a standard approach.
In Morisawa´s summary of the historical origins of modern quantitative geomorphology, she states that the "quantitative revolution . . . dates from the publication of Horton´s classic paper in 1945" in which some innovative methods for analyzing the development and functional systematics of drainage basins were devised and tested. These included stream network topological analysis, dimensional analysis, and an ordering methodology. This "revolution," supported by other quantitative studies in the early postwar period, in effect refocused the scale and scope of approach to landforms analysis downward from the "large area" or "regional" level of Davis, Penck, and others to the more manageable dimensions of study sites as small as quadrangles, segments of stream valleys, and even small clusters of individual landforms. Because of a strong dependence on measurements close-in or at a limited number of scattered sample sites, the emphasis shifted to studies in the field over areas that were commonly much smaller than geomorphic provinces. "Regional" gradually was supplanted by "local."
| Figure 12.7. (a) Part of a Landsat-1 scene (1342-07430-7) of an area in southwest Jordan (see Plate F-4) that has been contrast-stretched by computer processing; (b) the same scene after data have been high-pass filtered (101 by 101 pixel box); (c) modification of the scene by further filtering (31 by 31 box); (d) generation of an edge-enhanced image of the Jordanian scene by the horizontal derivative method. Images courtesy of P. Chavez, Jr., U.S. Geological Survey, Flagstaff, Arizona. | |
|---|---|
 |
 |
 |
 |
During the last 40 years, geomorphologists and physical geographers have concentrated much of their research on aspects of landform development that depend heavily on appropriate quantitative measures and tests. Most studies are process-oriented. The list of quantitative techniques and accomplishments from their use is long and impressive, as succinctly surveyed by Morisawa (1985). Some selected examples suffice here to illustrate the kinds of studies that typify the present state of quantitative geomorphology;
Some of these quantitative outputs have a feedback influence on other fields of geology. For example, a mainstay of tectonic geomorphology involves time-dependent measures of modifications of Pleistocene/Holocene fault scarps and related nearby surficial changes to deduce some indication of the time intervals between slip events. This can be translated to an estimate of frequency of recurrence of major earthquakes, a topic of extreme concern both to seismologists and to earthquake engineers.
Perusal of the foregoing list and other examples cited by Morisawa leads to the conclusion that some, perhaps most, of these conventional quantitative studies are not "do-able" primarily, if at all, through space observations or, for that matter, through the use of aerial photographs. They depend essentially on ground-based procedures and commonly require site access for collection of materials, gaging of rates, and intimate inspection of telltale signs at the outcrop level. There are exceptions of course: stream network analysis, dune migration patterns and rates, beachform transitions, and others can be done directly or at least can be assisted by the instantaneous samplings of surface appearance afforded by aerial and space images. Furthermore, repetitive coverage facilitates measurements of time-dependent changes in morphology of assemblages of landforms over areas or even regions rather than isolated points.
The question now becomes this: Does the paucity of reported studies of landforms using space imagery as a data base for quantitative measurements imply some inherent shortcomings or limitations in the type of data source? If the answer is no, the logical followup question is: What kinds of meaningful measurements can be done and, a corollary, must improvements be made in the imagery (mainly in the sensors that acquire the data and the processing that generates the end products) to entice geomorphologists to start utilizing the space observation data in a more quantitative way? Neither question is resolved in this book. No master plan for carrying out constructive measurements and devising new models is put forth. But, perhaps, the way(s) to introduce quantification will be suggested to interested geomorphologists by the pictorial and descriptive overviews of regional landforms that are the theme of the gallery chapters and are touched upon in Chapters 1 and 11. In short, although the full potential for quantitative studies of landforms from space has yet to be demonstrated, it is hoped that this book will inspire the geomorphology community to begin to develop appropriate approaches to image analysis that rely on effective measurements.
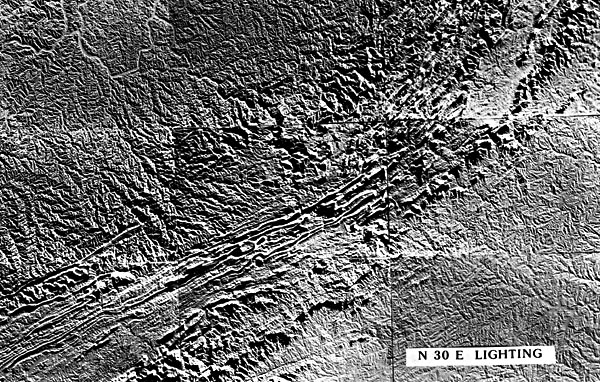
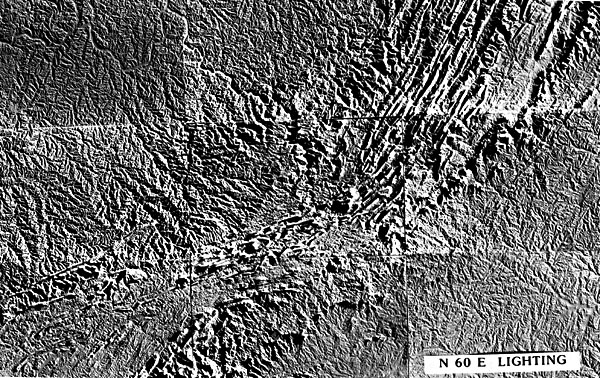
| Figure 12.8. (a) One of a pair of images of the southern Appalachian Mountains around Roanoke, Virginia (see Figure T-11.5) made by photographing a mosaic of raised relief maps that are illuminated from the side (obliquely) from different azimuths (here, N30°E) and elevation angles to enhance certain linear directions; (b) same as (a) except that ilumination direction is from N60°E (Wise et al., 1985). | |
|---|---|
 |
 |
Some work along these lines, carried on in the past several years, offers clues to what can be done with quantitative geomorphology at the regional level and how to go about it. A few examples with illustrations should clarify this issue.
Most likely, the key component in future quantitative studies of space imagery and other relevant kinds of data at regional scales will be the computer-a tool at last coming into its own for geomorphic analysis. Although some measurements can be extracted from space or aerial images (usually as transparencies on a light table) by employing customary photointerpretive methodology, much more information ultimately can be gleaned through computer processing. Surface data retrieved by remote sensors, especially scanners or CCD-based multilinear array detectors, are digitized on board space platforms and received in that mode, or if sent back as analog signals, these data too can be digitized; even photographs themselves can be converted by digitizing sensors (either line scanners or vidicons) any time after acquisition. In any case, the result is a sequence of numbers representing the sensed scene. For a Landsat image, these consist of an X-Y array (in successive raster-like scan lines) of sample points called pixels (picture elements), each containing some measure of a quantity (normally radiance, either as reflectance or emittance) emanating from an area on the Earth´s surface. When played back by an image-recording device, the digitized quantity values (commonly displayed on film as density variations (gray levels)) in their correct spatial positions produce a "picture" composed of spatial patterns defined by varying gray tones or by colors if multispectral image sets are superimposed and projected through color filters. More details about these fundamental ideas of image production from remote sensor data are reviewed in Appendix A. The main point to master now is that modern sensing technology can quantify geomorphic features seen at a distance-from which many kinds of numerical manipulations may then be executed.
Since most geomorphologists still feel more comfortable with pictures or images, one group of optional operations on these numbers during image processing will often be beneficial to their needs. These come under the category of enhancement techniques and include contrast-stretching, density slicing, and spatial filtering. To elucidate the value of enhancement in revealing more geomorphic details, consider the examples of spatial filtering presented in Figures 12-7a-d. Other, more specialized operations are described by such terms as ratioing, principal components analysis, differencing (for change detection), and geometric corrections. Mapping of varieties of features or classes (landforms, geologic units, landcover types, etc.) can be carried out by statistically based classification procedures. Several of these operations are discussed at some depth in Appendix A. Still other techniques, collected under the heading of pattern recognition, an automated approach to identifying objects and classes by their spatial configuration, boundary characteristics, contextual surroundings, tonal and textural aspects, and sizes, can in principle be adapted to discriminating, recognizing, and interrelating geomorphic entities. All of the above are directed toward a prime goal-to make the information in the data (be they numbers alone or in images) more obvious, more accessible, and more amenable to integration with other types of data.
| Figure 12.9. (a) A pseudo-stereo pair for a segment of the Atlas Mountains of Morocco (see Figure T-30.4) produced by merging digital topographic data with digitized Lansat data; (b) a merge between digitized thermal data (daytime temperatures) obtained by the HCMM satelite and the same Landsat image seen in (a); compare stereoscopically the apparent relief from thermal variations with the exaggerated natural relief derived from the topographic data set. | |
|---|---|
 |
 |
Data merging promises to open up new horizons in geomorphic analysis. Consider the following four examples. First, topographic maps can easily be digitized, storing elevations and other information for ready retrieval to reproduce the maps, as well as to create derivative maps. Computer routines exist to plot the contours in a quasi-three-dimensional mode with the ability to rotate the resulting scene into any aspect or perspective desired. Or, images resembling shaded relief maps can be generated from digital terrain tapes, in which not only aspect but also direction and angle of illumination might be varied (Figures 12-8a-b). New information is presented in each individual rendition. This technique works especially well in emphasizing fractures and other types of lineaments inasmuch as linear features oriented perpendicular to the illumination direction (particularly at low angles) are highlighted relative to those features progressively more aligned to that direction.
The second example illustrates how a Landsat image can be converted into a format "dear to the heart" of any geomorphologist (i.e., one capable of being viewed in relief or three dimensions). Again, using digital elevation tapes, the Landsat pixels are individually shifted in position proportional to some slope function derived from the merged elevation data to yield a second image in which the perspective is equivalent to that of a stereo pair. This pseudo-stereo product (Figure 12-9a) can be made from any kind of data set that can be contoured. Thus, a sense of relief on a Landsat pictorial background is generated in Figure 12-9b from contoured thermal data; gravity, aeromagnetic, subsurface structural data are also treatable in this way.
The third case combines elements of the first two (Figure 12-10). Here, a small part of a Landsat scene of the Alaska Range has been altered into the three-dimensional state and then viewed obliquely, as though one were photographing the scene from an aircraft. Now at last, the geoscientist can take an aerial reconnaissance field trip from the comfort of a laboratory desk chair seated before a monitor-a simulated flight through the Grand Canyon has been produced by computer that engenders the stunning illusion of actually being airborne.
| Figure 12.10. A computer-generated perspective view of Mt. McKinley as though seen from an elevation 4800 m above the Tokositna River in Alaska, produced by combining Landsat data with digital elevation data. Courtesy of National Mapping Division, U.S. Geological Survey EROS Data Center, Sioux Falls, South Dakota. | 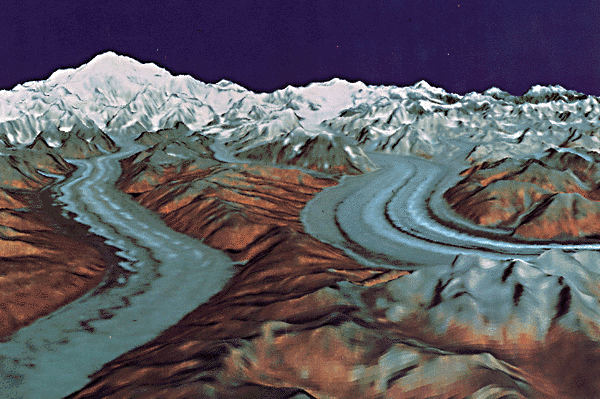 |
|---|
The last example describes a derivative map made from digitized terrain data but one that also can be constructed from calculations of slope steepness using stereo data from such systems as the French SPOT, the Large Format Camera, or the limited sidelap coverage from Landsat. Figure 12-11a is a shaded relief map generated from 1-km2 resolution cell elevation data contained in digitized (NOAA) 30-sec topographic elevation tapes. The area shown includes several accretionary terranes in and around the Klamath Mountains of southwest Oregon. In Figure 12-11b, several ranges of slope steepness have been assigned levels of gray. The resulting pattern instantly singles out sections in the region with topographic ruggedness quite different from other sections. These differences are in part related to the varying resistances of underlying geologic units to erosion and to their structural configurations, both in turn governing to some extent the elevations of the terrains, the gradient-influenced energetics of stream-cutting, and the interactions between mass-wasting and slope stability. These patterns can be compared (e.g., by overlaying) with other types of (digitized) maps (themselves reducible to patterns with varying degrees of detail), including maps of accretionary terranes. Explanatory correlations may then be made by "eyeball" or, better yet, through statistical tests to assess the contributions of pertinent variables to disclose other relations.
| Figure 12.11a. A shaded relief map of parts of several states in the western United States produced from 1-km2 cell data contained in digitized 30-sec topographic elevation tapes. | 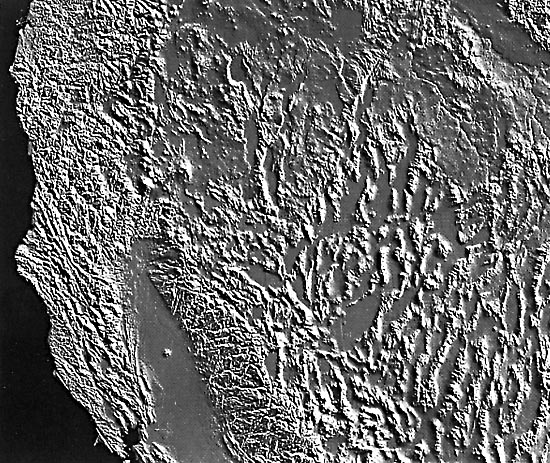 |
|---|
When analyzed together, multiple sets of data, including different thematic maps, are valuable aids to geoscientists in better understanding geologic phenomena-particularly process interactions and genetic factors associated with such diverse subjects as orebody formation, location of oil pools, likelihood of earthquakes or volcanic eruptions, trends in sedimentary facies variation, and distributions of multiple intrusions. Some of these topics are practical in nature and involve economic decision-making; others are more strictly scientific. The rapid growth of computer technology in the last decade has fostered a new systems approach to handling and integrating diverse data sets. (In the past, maps of several kinds for the same area were simply spread out side by side on a table and compared visually back and forth.) This approach frequently is referred to as a Geomorphic Information System or GIS (see Chapter 7 in Short, 1982). Any map showing some type of information about the Earth´s surface or interior horizons can be subdivided into location cells (referenced to X-Y or X-Y-Z space), and information presented by the map pertaining to each cell can be encoded into a data base. Each map can be reconstructed and manipulated on a computer display; in some instances, direct overlays of one or more maps can be superimposed on a selected base map. More important, entirely new types of maps can be generated from varieties of data in the location cells. For practical uses, these maps serve as the end products of a decision-making or interpretation process; for example, a suitability map might pinpoint the optimum places to drill for ground water. Essential to their use is an appropriate mathematical or conceptual model that draws on the varieties of data available to execute the process. Figure 12-12 is a simplified example of a GIS analysis that uses multivariate data to define the best (highest numbers) places(s) for some type of site selection. In Figures 12-13a-c, three examples of theme or ordinal ranking maps of geomorphic relevance, as generated from a multiple data base and color-coded for image output, illustrate the power of the GIS approach. The potential of a GIS for conducting various geomorphic analyses in a systematic, quantitative way should be almost self-evident. The role of space imagery in such a system is twofold. First, the images are often the best database on which to fold in data of other kinds for display. Second, updates over time, yielding multitemporal data, are often needed in many kinds of studies, including some of a geomorphic character; continuously operating observatories such as the Landsats since 1972 provide both a time base for comparison and a constant source of new, timely data.
| Figure 12.11b. A generalized slope steepness map (steeper slopes shown in lighter gray tnes) for an area within the Klamath Mountains in Oregon, derived from the topographic data referred to in (a). | 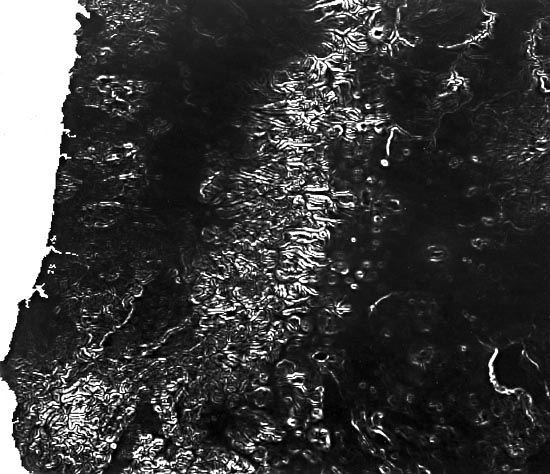 |
|---|
This section of the chapter has been included to convince the reader of just one straightforward idea: space imagery (and attendant data) offers exceptional possibilities for expanding (or, more frankly, returning) quantitative geomorphic analysis to a regional level, especially in view of the new computer technologies now evolving (e.g., incorporation of expert systems (in the field of Artificial Intelligence) to improve decision-making capability). Future studies of Geomorphology from Space will lead to a higher quality of results as this approach is followed.
NEW DIRECTIONS FOR GEOMORPHOLOGY
"One of the lessons from space is to ´think big´ " (Sharp, 1980). This expresses a major new direction for geomorphology, the "global perspective," which ought to complement existing knowledge from meso- and micro-geomorphic investigations. At the Tucson Workshop, four concepts provided an investigative framework pointing the way toward future directions in geomorphology. These are: (1) Global Geomorphology, (2) Inheritance and Evolution, (3) Process Thresholds, and (4) Planetary Perspectives. These concepts are not inherently independent of one another, but form interconnected themes for approaching the future of geomorphological research. The Tucson Workshop agreed on a number of major questions around which global concerns should be centered (Douglas, 1985). Eight of these are discussed below.
| Figure 12.12. Diagram illustrating the steps involved in obtaining a Site Suitability map by conducting a Geographic Information System. (GIS) analysis; 15 denotes maximum suitability (Short, 1982). | 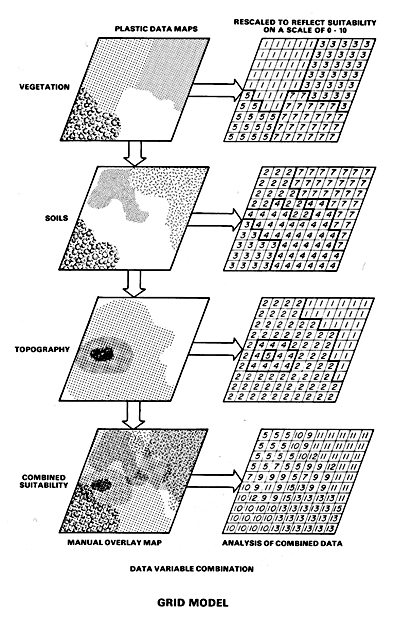 |
|---|
The first four questions deal with the Earth´s surface from an essentially static aspect, whereas the next four require sequential imaging to detect changes over time. The last of these addresses a state of the Earth that no one wishes to observe except as demonstrated through an artificial scenario. This question of effects of nuclear war on surface environments was only alluded to at the Tucson Workshop, but it remains one of potential significance in this age of atomic weapons. All of these questions are prone to solutions that fall back on space technology to give a global perspective-in other words, viewing the Earth as a single complex dynamic system-a planet.
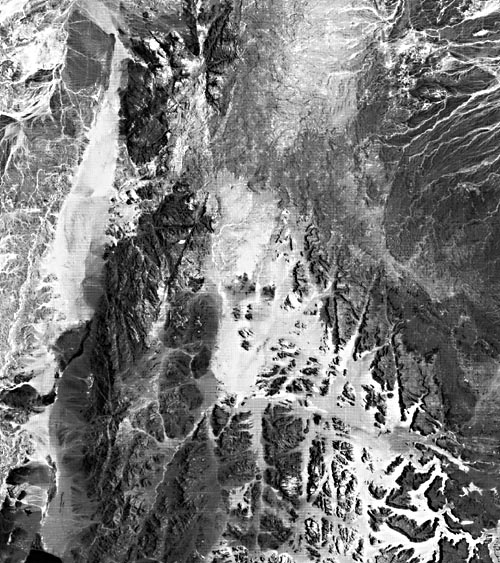
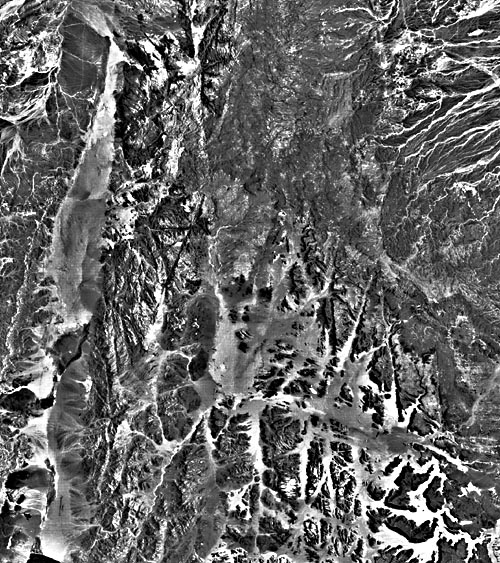
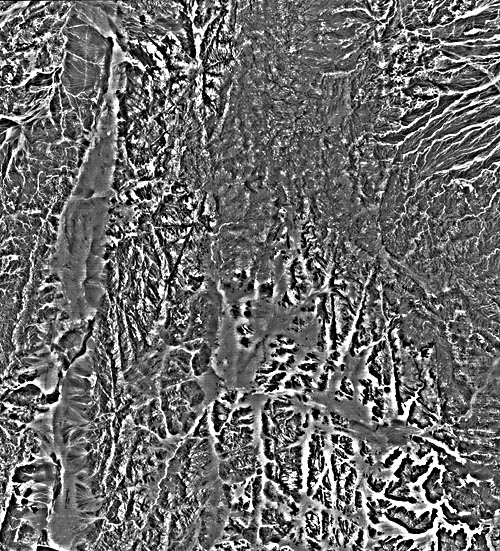
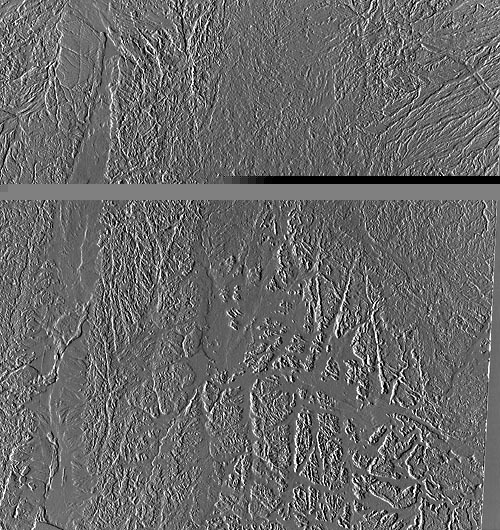
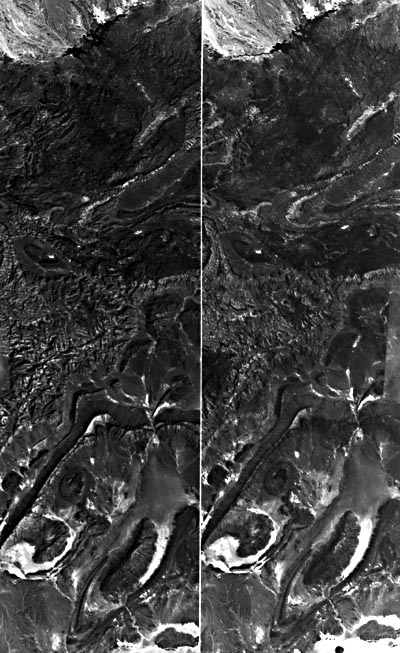
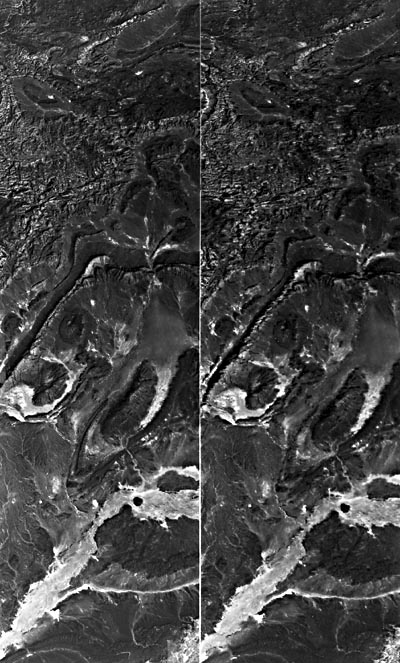
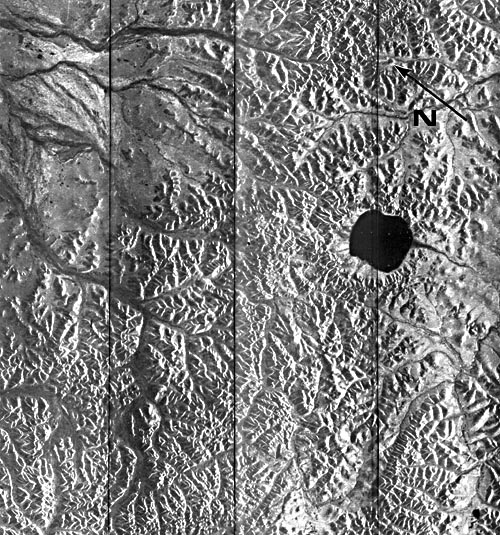
A plausible analog to nuclear winter could come out of investigations of past climatic effects arising from the impact of large extraterrestrial objects (mainly asteroids), particularly those that excavate craters greater than 20 km in diameter. Recently, considerable attention has been focused on a number of Phanerozoic large-impact structures because of their possible causal relationship with major extinctions in the biological record (e.g., Cretaceous/Tertiary at 65 Ma and Eocene/Oligocene at 34 Ma; Silver and Schultz, 1982). The most recent (approximately 3 Ma) large-impact structure is the Elgygytgyn crater in the Chukotka region of the far-eastern U.S.S.R. Although slightly glaciated, this 23-km diameter structure is reasonably well preserved for an Arctic landform. The crater is dominated by a fault-bounded rectangular lake approximately 18 km in width. Fieldwork by Gurov and colleagues (1979, 1982) has identified the diagnostic signs of a tremendous impact event, including high-pressure quartz phases and impact melt bombs. Attention was originally focused on Elgygytgyn when Landsat images suggested an impact origin for the remote feature (Dietz, 1977). Elgygytgyn is located above the Arctic Circle in an eroded volcanic terrain (Cenozoic tuffs and flows), several hundred kilometers from the nearest town. The four images in Figure 12-14 are views of the giant crater at different scales. The first (Figure 12-14a) is an oblique airphoto with a l-m resolution. The other three were acquired from space-based systems. The 25-m resolution Seasat radar image (Figure 12-14b) provides comparable information to the 79-m resolution Landsat MSS image (Figure 12-14c). The HCMM scene (Figure 12-14d), at 500-m resolution, reveals less about the crater than it does about the regional erosional pattern. Impacts of the same magnitude as that which created Elgygytgyn could have produced transient "nuclear winters" that might have accelerated the onset of periodic global ice ages (Silver and Schultz, 1982). Analyses of available remote sensing data for the Elgygytgyn region (Garvin and Grieve, 1986) and the environs of other well-preserved giant impact features suggest that widespread climatic effects are not unreasonable in spite of the lack of extensive geomorphic effects. Even though many of the obvious geomorphic effects of large impacts can be eroded away in tens of millions of years (e.g., most of the surface ejecta around Elgygytgyn has been removed in only 3 Ma), impact craters retain some of their characteristic geomorphic expression for longer periods of time, attesting to the immense energies involved in their formation. Geomorphic studies of such structures at several scales could shed new light on catastrophic geologic events and their role in the geomorphological evolution of the Earth´s surface.
| Figure 12.13. Thematic maps produced by GIS processing of digital data in an elctric utilities company information base and covering the area around Harrisburg, Pennsylvania (including the Susquehanna River and the Blue Mountain ridge of the folded Appalachians (Short, 1982). | ||
|---|---|---|
 |
 |
 |
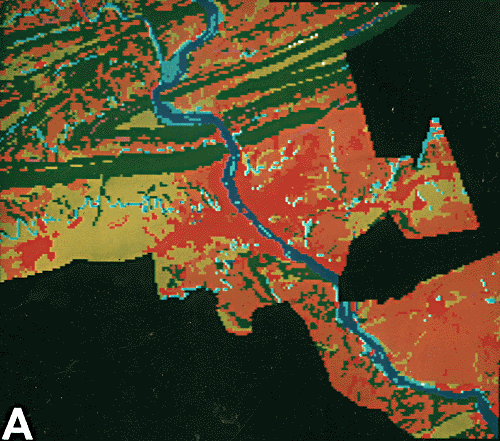
| Figure 12.13a. a. Landforms Red: Urban Dark blue: Water Brown: Pleateau Purple: Mountain Top Dark green: Steep Slope Light green: Valley bottom White: Depression Aqua: Floodplain |
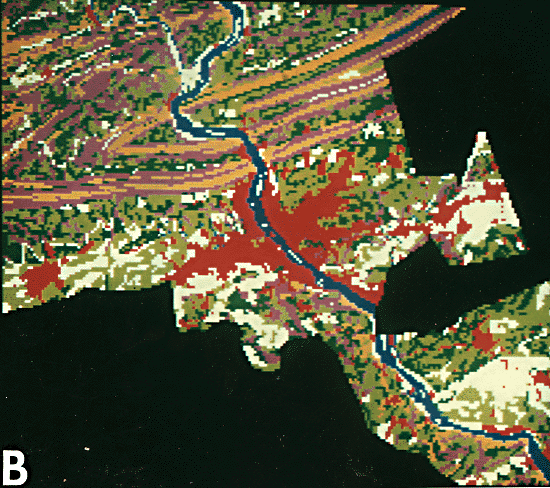
Figure 12.13b. b. Slope White: 0-3 % Light green: 3-8 % Dark green: 8-15 % Purple: 15-25 % Yellow: >25 % Red: Urban Dark blue: Water |
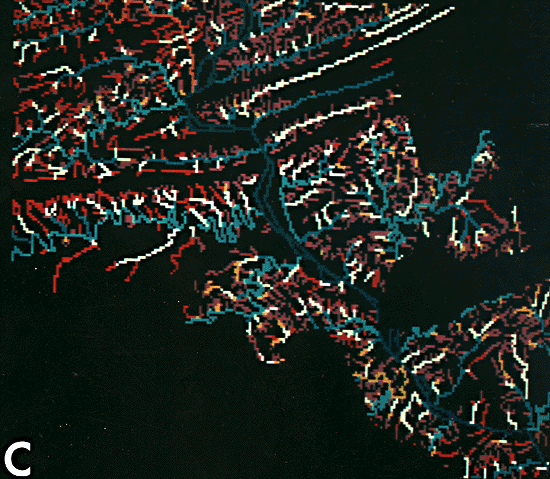
Figure 12.13c. c. Stream Order Dark blue: 1st order Orange: 2nd order Aqua: 3rd order Light blue: 4th order Yellow: 5th order White: 6th order Purple: 7th order Red: 8th order |
Besides the questions related to global geomorphology, numerous other topics were addressed at the Tucson Workshop. For example, geomorphological studies of landscape evolution and inheritance have dwelled primarily on the Quaternary and Recent changes that are generally assumed to dominate most of the Earth´s present landscapes. The workshop questioned this latter assumption by pointing out that landforms of great age are being recognized as more common and extensive than previously believed (Twidale, 1985). Ancient exhumed surfaces have been recognized in shield areas and in some of the older orogenic belts, where for part of their history, they remained buried until now reexposed by erosion. There are also epigene features, many of Mesozoic age, which had never been buried but have resisted alteration by weathering and other processes over very long time periods. Etchplains formed of resistant rock at a weathering front are more widely distributed than had been previously suspected. At the workshop, the point was raised but not answered as to whether space imagery can be used to assess the true extent of these ancient landforms and the reasons for their survival.
| Figure 12.14a. Aerial photograph of Elgygytgyn Crater, northeastern Siberia, U.S.S.R. (courtesy of B. Ivonov). | Figure 12.14b. Seasat radar image of Elgygytgyn Crater and the surrounding region. |
|---|---|
 |
 |
| Figure 12.14c. Landsat MSS image of Elgygytgyn Crater and surrounding region. | Figure 12.14d. HCMM image of Elgygytgyn Crater and surrounding region. |
|---|---|
 |
 |
The concept of thresholds has increased in importance in geomorphological investigations (Ritter, 1985). The idea stems from the premise that boundary conditions exist within geomorphic systems beyond which different processes become dominant or existing processes change in rate and magnitude. For example, if pristine river water remains clear after running over a sandy bed, the boundary conditions leading to erosion presumably were not surpassed. But an increase in volume, gradient, or other factors, bringing about a rise in velocity, may carry the system across the threshold boundary conditions, causing sand particles to be picked up and moved. The perception of thresholds on a regional scale from space is a real challenge, but is not out of the question. For example, the Columbia Glacier near Valdez, Alaska (Plate G-11), has been retreating slowly for years, producing a moderate number of icebergs. Then, in 1981, a sudden increase in the production of icebergs, to such an extent that it jeopardized existing sea lanes (Kelly, 1981), forced some threshold boundary condition to be surpassed. In this instance, it was the unlocking of the Columbia glacier from a bedrock knob that had anchored and added stability to the ice stream. When unlocked, the snout of the glacier underwent an increased breakup rate with the fjord. Monitoring the iceberg density from space could have pinpointed the time of threshold change even had it occurred in some remote region of the world. The space perspective assists the investigator in observing where and possibly when threshold boundaries have been exceeded, but will probably not allow the scientist to determine the complex causes of the change without going into the field for closer examination. Although an indepth comprehension of thresholds and long-term geomorphic changes appears unattainable at present, geomorphologists can begin to initiate long-term experiments, some not coming to fruition for a century or more, that can nevertheless serve as an important contribution to future geomorphic research (Williams, 1985).
| Figure 12.15a. Venera 15/16 radar image of Lakshmi Plateau and surrounding region of Venus. |
|---|
 |
| Figure 12.15b. GLORIA sonogram of Charles Gibbs Fracture Zone, an active transform fault on the Mid-Atlantic Ridge. |
|---|
 |
| Figure 12.15c. GLORIA side-scan sonogram of the Juan de Fuca Ridge, Vance Sea mount, and Blanck Fracture Zone off the Washington Coast. |
|---|
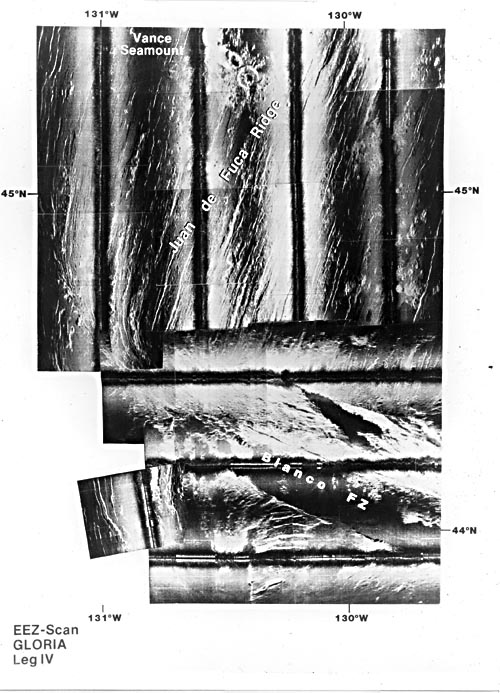 |
For geomorphologists to study the Earth from the planetary perspective, the effort requires more than the simple incorporation of satellite and other space imagery into their methods. The Tucson Workshop singled out the need for a fundamental philosophical change of direction so that, in the future, the Earth will be perceived as a planet like any other Solar System body (Rossbacher, 1985). Through exploration of the Moon and other planets of the Solar System, we have become aware of the immense variety of landform types, scales, and ages that exist. A major focus in the study of planetary landforms is the identification of terrestrial analogs, thus enabling investigators to adopt hypotheses pertaining to their origin and to the processes involved. Consider, for example, the recent Soviet radar imagery of the Lakshmi Plateau and its surrounding area on Venus (Figure 12-15a). This scene shows linear faults or fractures similar to terrestrial features such as the Charlie Gibbs Fracture zone, an active transform fault along the mid-Atlantic ridge south of Iceland (Figure 12-15b), and the Juan de Fuca Ridge and Vance Seamount (Figure 12-15c) in the Pacific Ocean west of Washington State. However, it is dangerous to apply Earth-derived models directly to explain various planetary landforms because the other planets depart from the Earth in many important environmental parameters such as atmospheric bulk composition and pressure, water content and state, degree of tectonism, and lithologic materials. The images of the planets, however, have given us "snapshots" back into time of processes, such as impact cratering, that dominated the early Solar System and may have been intermittently important in more recent eras.
CONCLUDING STATEMENT
For almost as long as the human race has existed on Earth, people have expressed a curiosity about the nature of their surroundings. They have sought to learn more about the landscapes upon which they live and processes by which those landscapes formed and continue to evolve. Until recently, a person´s view has been limited to what could be observed, on site, about the immediate surroundings. Moreover, the vistas were restricted to samplings of less than one-third of the total planetary surface seen normally from the ground up. Now new technologies growing out of space exploration, some of whose products are well portrayed by the illustrations in this book, offer exceptional opportunities to study and analyze the Earth from above. This takes advantage of the synoptic planetary view to gain new insights into the nature of Earth, its place in the Solar System, and the multiple processes by which its landscapes have been formed. With the new technologies for charting the ocean floor, the entire planet is being opened to careful scientific investigation. The challenge of the Earth Sciences is to make effective use of appropriate new technologies to gain the broadest possible understanding of the Earth and its features. In a world becoming more crowded because of the rapid expansion of the human population, with its concomitant threat to other creatures that share this planet with man, the study of geomorphology from space has a vital and exciting role to play in understanding more fully the nature of Earth. This promises assurance that habitability of land and sea can be preserved and enhanced for the future of all Earth´s creatures.
Continue to Chapter 12 References| Return to Home Page| Complete Table of Contents|