 |
 |
|---|---|
| Plate KL-12 | Map |
|
|
|---|---|
| Plate KL-12 | Map |
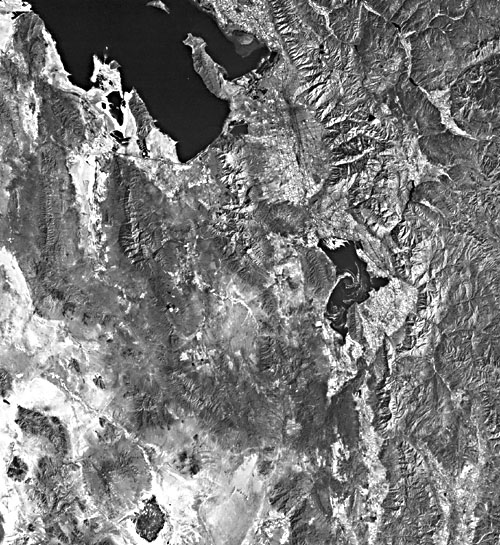
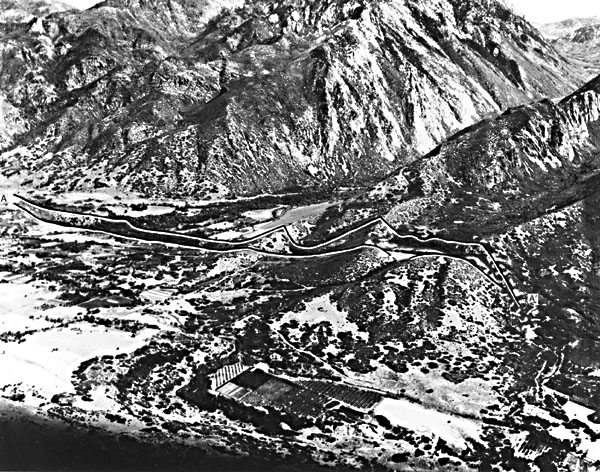
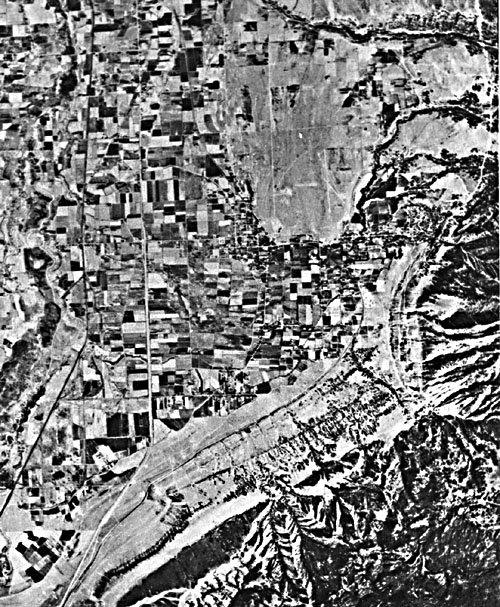
One of the great pluvial lakes of North America is Lake Bonneville, which was first studied and reported in detail by G. K. Gilbert (1890). The modern remnants of this huge lake are the Great Salt Lake, Utah Lake, and Sevier Lake. This image of Utah includes the Utah Lake and the southern end of the Great Salt Lake. These two lakes lie at the northwestern edge of the Great Basin Section in the Basin and Range Province. The Wasatch Mountains front (see index map) marks the boundary between the Great Basin and the Middle Rocky Mountain Province to the east. For the most part, this mountain front conforms with the Wasatch dip-slip normal fault zone that can be traced for many kilometers both north and south of the image. The Wasatch fault scarp is a Late Cenozoic feature. Locally, it displaces moraines of the Bull Lake glaciation and other deposits (Figure KL-12.1). Some segments of the fault are considered to be active.
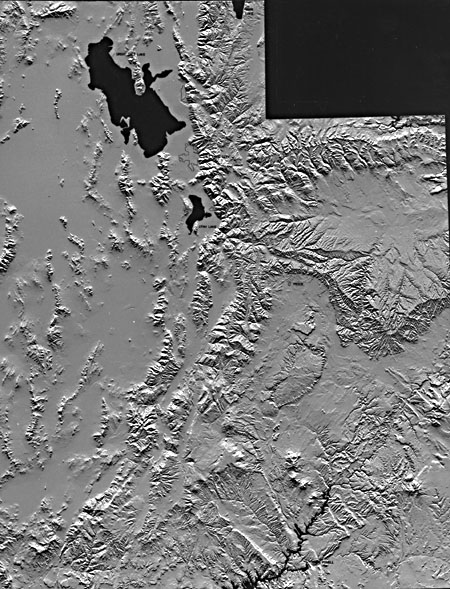
When Lake Bonneville expanded to its maximum size, it drowned at least 50 percent of the image area. A hint of this is given in Figure KL-12.2, a computer-generated shaded relief image of Utah made by the U. S. Geological Survey at Flagstaff using DMA topographic data tapes, in which the uniform flat tones along the left side of the image correspond roughly with areas likely to have been inundated. Several times in the past, the lake attained an area of about 51700 km2, nearly the size of present-day Lake Michigan, and maintained water depths of as much as 335 m (Morrison, 1965). Eardley et al. (1973) have analyzed in detail a 307-m core that penetrated lake sediments at Burmester, Utah, just south of the Great Salt Lake. The core records about 3 million years of history. Over the last 800 000 years, 28 episodes of subaerial exposure interrupted by lake-fill cycles have been identified. Most investigators agree that the high lake levels are associated with cool climatic intervals in which the volume of precipitation and runoff exceeds the evaporation. During warmer climatic episodes, the relationship was reversed.
| Figure KL-12.1 | Figure KL-12.2 |
|---|---|
 |
 |
There are more than a dozen distinct lake shorelines representing various lake stillstands (Thornbury, 1965). The shorelines form distinct benches or wave-cut platforms such as those along the northern flank of the Traverse Mountains (Figure KL-12.3 and Figure KL-12.4). These former lake levels are usually associated with lake sediments, deltas, and calcareous tufa. The most significant of these shorelines are the Bonneville (1550 m) and Provo (1450 m), which represent the most recent of the high lake levels (Scott, et al., 1983). The present level of the Great Salt Lake is about 1285 m, although this periodically fluctuates with the local variations in climate.
Although the shorelines are clearly displayed along much of the eastern margin of the lake basin, considerable controversy has developed over the sequence and timing of the last lake- filling episodes. From a low lake level 11000 to 12000 years ago, Morrison (1965) suggests that the lake rose to a 1450-m level 10000 years ago. Scott (1979), however, shows some evidence that no such rise took place. The history of lake fluctuations is complex, especially when one considers that the last high lake episode would tend to either wipe out or modify features produced by preceding levels and that most of the lake deposits are very similar. The most recent chronostratigraphic work is based on amino acid dating of gastropod shells and radiocarbon dating of wood from lake sediments (Scott et al., 1983). The dates obtained indicate that, within the last 150 000 years, two major episodes of lake filling occurred. The earliest of the two fill cycles ended about 130 000 years ago and attained a high water level just below the present Bonneville shoreline. The Bonneville shoreline represents the highest water level reached during the last lake-fill cycle, which began about 25 000 years ago. This 1550-m level was reached approximately 16 000 years ago and was maintained for about 1500 years (Scott et al., 1983).
| Figure KL-12.3 | Figure KL-12.4 |
|---|---|
 |
 |
The end of the Bonneville stage is associated with the lake overflowing through an outlet into the Snake River drainage at Red Rock Pass in southern Idaho. Rapid downcutting ensued, resulting in the release of 1590 km3 of water, mostly over a period measured in weeks, to produce the Bonneville Flood (Malde, 1968). The readjusted lake level, 100 m below the Bonneville shorelines, was maintained for possibly 2000 years to create the Provo shoreline. This was followed by a steady decline of the lake level until 11 000 years ago when the water level was just 9 m above the present Great Salt Lake (Scott et al., 1983).
Former lake shorelines are not the kind of geomorphic feature that readily shows up at the scale of Landsat imagery; however, careful examination of the Plate image reveals the hint of shorelines in the Traverse Mountains (A on index map) and in the McDowel Mountains (B), showing the vast extent of the Pleistocene lake. Landsat 10051-17420-7, September 12, 1972.
Continue to Plate KL-13| Chapter 7 Table of Contents.| Return to Home Page| Complete Table of Contents|