 |
 |
|---|---|
| Plate G-1 | Map |
|
|
|---|---|
| Plate G-1 | Map |
An ice sheet is defined as "a mass of ice and snow of considerable thickness [ >1000 m] and large area[ >50000 km2]. Ice sheets may be resting on rock [Plate G-1] or floating [Plate G-2]. Ice sheets of less than about 50 000 square km resting on rock are called ice caps [Plate G-5]" (Armstrong et al., 1973). Of all the glacier ice on our planet today, only Antarctica and Greenland contain composite masses of glacier ice larger than 50 000 km2 (Table 9-l). During the Pleistocene, however, many regions contained composite masses of glacier ice that qualified as ice sheets (Table 9-2). In fact, the Laurentide Ice Sheet rivaled Antarctica in areal extent (Figure 9-1).
During a lunar mission, one of the Apollo 17 astronauts captured much of Antarctica on photographic film (Figure 9-2), becoming the first human to see most of that continent in one instant. For useful scientific information, however, polar-orbiting spacecraft, with various types of remote sensing devices, have been used to systematically acquire successive frames or strips of image data of Antarctica. This image data can be analyzed separately or in mosaic form. Drewry (1983) used Landsat images to correct parts of the coastline for the new 1:6 000 000-scale Scott Polar Research Institute base map of Antarctica. Many nations are using Landsat images to prepare planimetric image maps of Antarctica (Williams et al., 1982) and as base maps for geological maps (Wolmarans and Krynauw, 1981; Tingey and Convine, 1982). Zwally et al. (1983) used mosaics of Nimbus 5 electrically scanned microwave radiometer (ESMR) images to prepare a monthly, seasonal, and year-to-year atlas of variations in sea-ice cover around Antarctica between 1973 and 1976.
| Figure G-1.1 | Figure G-1.2 |
|---|---|
 |
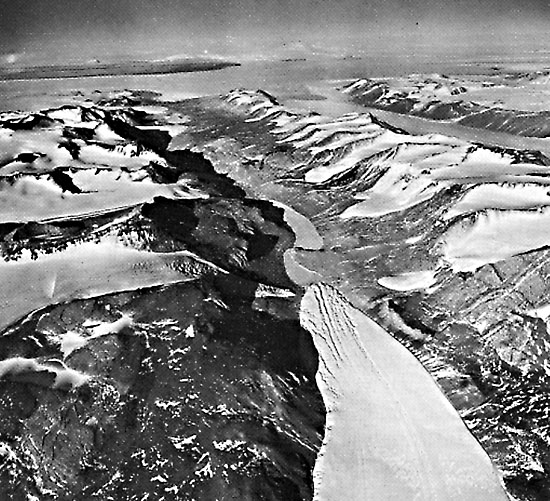 |
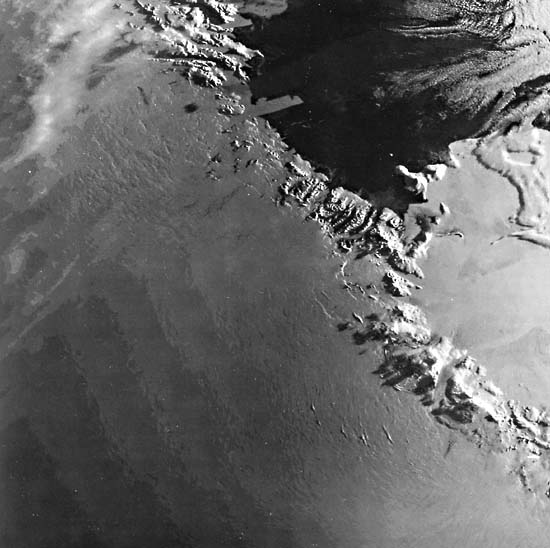
Plate G-1 is a NOAA-6 advanced very high resolution radiometer (AVHRR) image of that part of Antarctica, including the primary logistical base (McMurdo Station), which is the center for scientific research by the United States. Only large-scale features can be discerned on this NOAA image, which spans a region about 1000 km wide. Part of the Ross Ice Shelf, Transantarctic Mountains, the so-called "dry valleys" area (e.g., Taylor Valley), Mount Erebus volcano, Drygalski ice tongue (the floating seaward extension of David Glacier), and the various outlet glaciers that originate in the inland ice can be seen on this image. The 5 steps (shades) of gray appearing as bands in the bottom left quadrant of the image are artifacts produced during image processing.
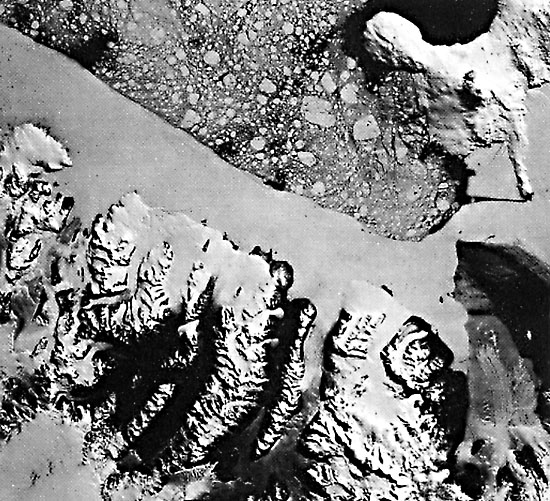
Figure G-1.1 is a Landsat-1 MSS image of a small part of the area imaged in Plate G-1. Figure G-1.2 is an oblique aerial photograph of part of Taylor Valley (one of the "dry valleys" of Antarctica) looking toward the Mount Erebus volcano. Until the past decade, when vertical aerial photographs of selected sites in Antarctica began to be acquired, the trimetrogon camera (tricamera) configuration (one vertical camera, two oblique cameras) was the principal source of photographic data used to prepare maps of Antarctica. Because only about 20 percent of Antarctica has been mapped at scales of 1:250 000 or larger (Swithinbank, 1980), much remains to be accomplished. Plate G-1 and Figures G-1.1 and G-1.2 represent a nested set of images of Antarctica, each providing different types and scales of information. NOAA images provide synoptic coverage (including around the South Pole where Landsat does not image), which is important to monitoring changes in coastline configuration and variations in sea ice, although microwave images would be superior because of the cloud-penetrating capability of microwave energy. If Antarctica were cloudfree, the polar convergence of Landsat orbits means that only about 520 images, instead of a total of 2514 nominal scenes, would be required to cover Antarctica from the coast to 81°S latitude, assuming minimal sidelap of adjacent images.
| Figure G-1.3 |
|---|
 |
The great size of Antarctica presents a formidable barrier to gaining a better understanding of the geological, geophysical, and glaciological character of this continent. It is clear that the preparation of adequate base maps and other types of related studies of Antarctica will require major utilization of existing and future space technology (Swithinbank, 1983).
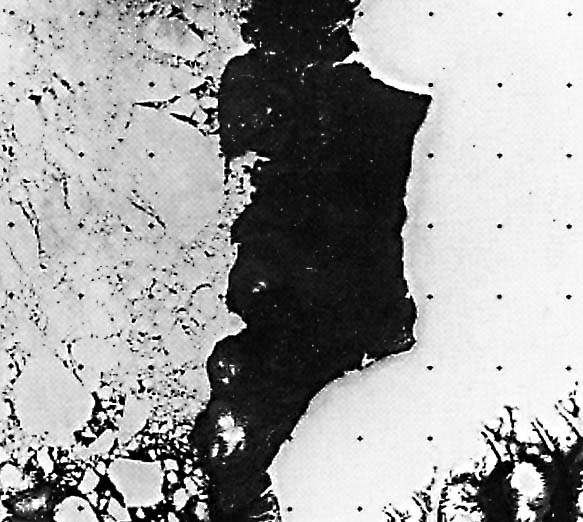
Figure G-1.3, from Williams and Ferrigno (1981), is a Landsat RBV band 2 image of northwestern Greenland. Taken on July 29, 1976, this image shows the well-defined edge of the Greenland Ice Sheet in the Inglefield Land area on the right and numerous outlet glaciers emptying into fjords. Several nunataks are visible on the southeast edge of the image. Sea ice fills the Kane Basin on the left, and part of Ellesmere Island, Northwest Territories, Canada, is visible in the lower left-hand corner of the image (see also Figure G-4.4). NOAA 6 AVHRR, Ch. 2, 1812Z, February 27, 1980.
Continue to Plate G-2| Chapter 9 Table of Contents.| Return to Home Page| Complete Table of Contents|