 |
 |
|---|---|
| Plate G-9 | Map |
|
|
|---|---|
| Plate G-9 | Map |
A valley glacier can be defined simply as "a glacier which flows down a valley" (Armstrong et al., 1973). A valley glacier can originate from one or more cirques (Plate G-8) or as an outlet glacier from an ice cap (Plate G-6) or ice sheet (Figure G-6.3). In either case, the glacier ice is constrained to flow within the walls of a valley-a valley that is usually initially created by preglacial stream erosion. Glacial troughs or U-shaped valleys (see Figure 9-20 and Plate G-13), typical landforms resulting from glacial and fluvioglacial erosion, will be discussed in Plates G-12 through G-14. A synonym for valley glacier is alpine glacier, because the latter is the dominant glacier type in the Alps of Europe. Bates and Jackson (1980) define an alpine glacier as"any glacier in a mountain range except an ice cap or ice sheet. It usually originates in a cirque and may flow down into a valley previously carved by a stream."
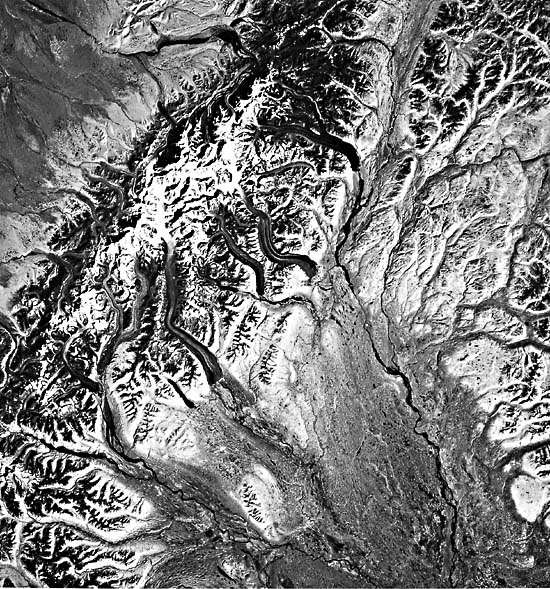
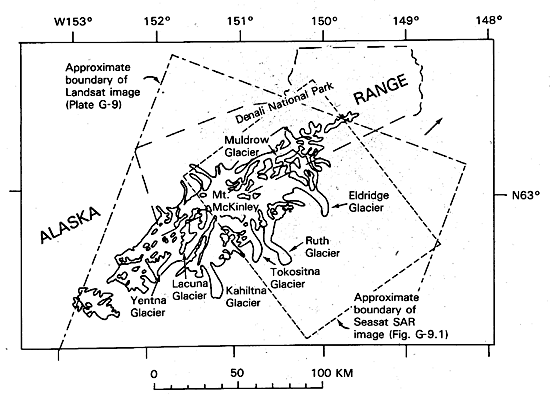
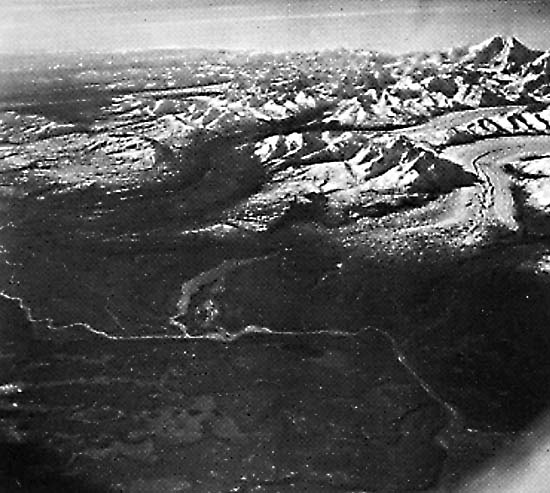
The higher elevations of the western part of the Alaska Range, especially in the segment that extends 60 km northeast and 90 km southeast of Mt. McKinley, give rise to a large number of valley glaciers that originate from numerous cirques (American Geographical Society Glacier Studies, 1975b). Plate G-9, a Landsat image of part of the western part of the Alaska Range, shows the many valley glaciers, both surging and nonsurging, that originate from cirques on the flanks of the Mt. McKinley massif. The index map shows the principal glaciers of the Mt. McKinley massif, and the overlapping outlines of the Landsat image and the Seasat SAR image (Figure G-9.1) (Denton and Field, 1975). The eight principal valley glaciers can be clearly seen on the southeast side of the western part of the Alaska Range. Three of these glaciers, the Tokositna, Lacuna, and Yentna Glaciers are classified as surging glaciers (Post, 1969) because of their peculiar flow characteristics. As was discussed by Meier (1976).
| Figure G-9.1 | FigG-9.2 |
|---|---|
 |
 |
"Nonsurging glaciers, such as the Ruth and Kahiltna, flow at quite uniform rates of only a few centimeters or tens of centimeters per day, and the medial moraines-dark-colored strips of rock fragments stripped from mountains situated between tributary glaciers-are quite straight and uniform. On the other hand, such surging glaciers as the Tokositna, Lacuna, and especially the Yentna have wiggly folded moraines that result from alternating periods of near stagnation (lasting up to 50 yr) and of extremely high flow rates (lasting 1 to 3 yr when the ice may flow faster than 1.3 m/h)."
"The Tokositna Glacier had completed [in 1972] a surge that began in 1970. The Lacuna Glacier has been in a stagnant condition for 40 or more yr, and its dirty mottled surface shows the effects of severe melting. The Yentna Glacier was first observed surging in 1972. This image shows its folded moraines displaced more than 1800 m down valley from their positions shown on recent maps and 1970 aerial photographs. Also visible on the Landsat image is a dark line (i.e., lateral moraine of Yentna Glacier) where the rapidly flowing Yentna Glacier has sheared across the stagnant ice of the Lacuna Glacier."
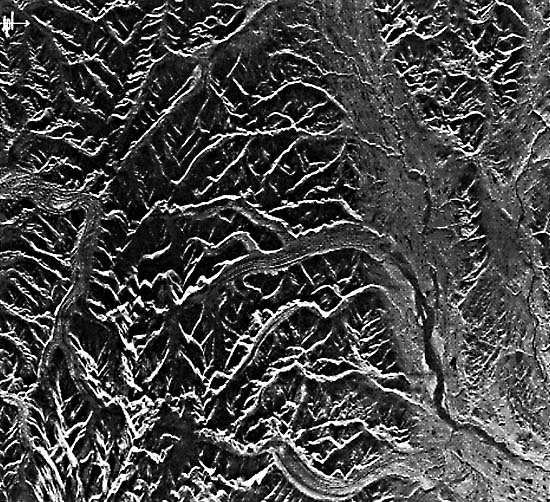
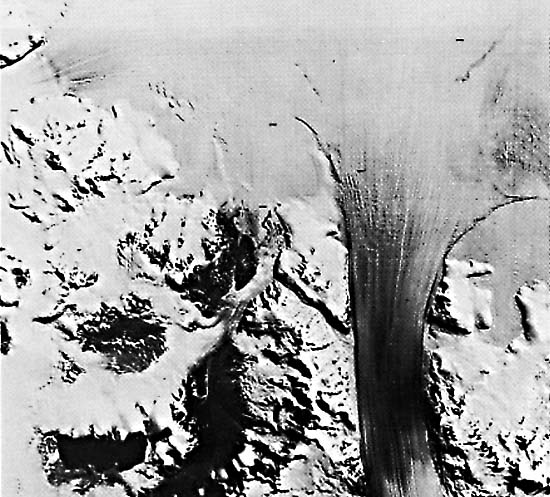
Figure G-9.1 is a digitally processed Seasat SAR image of the eastern half of the western part of the Alaska Range showing valley glaciers and associated glacial landforms. The SAR image overlaps the northeastern corner of the Landsat image, as can be seen on the index map. The Muldrow Glacier and the Eldridge, Ruth, and Tokositna Glaciers are the main valley glaciers shown on both images. Figure G-9.2, an oblique aerial photograph showing the upper reaches of the Eldridge Glacier on October 4, 1965, shows the coalescence of numerous tributary cirque glaciers that form this large valley glacier. It originates on the southeastern flanks of the Mt. McKinley massif. Mt. McKinley, the highest peak in North America (6195 m), is in the background.
| Figure G-9.3 |
|---|
 |
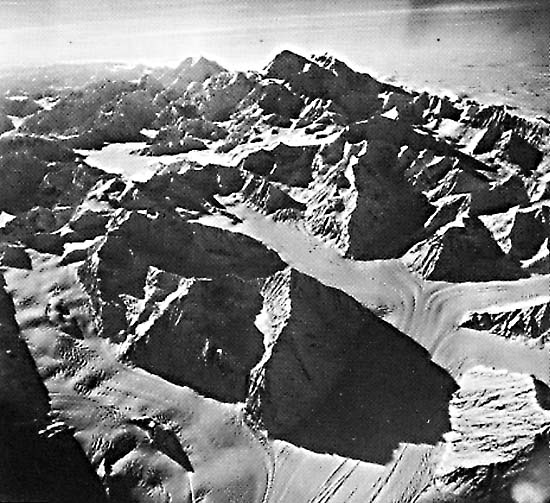
The Seasat SAR image (Figure G-9.1) of part of the Alaska Range was analyzed by John Ford (written communication, 1983) and by Ford et al. (1980). Because radar images are more sensitive to topographic texture, the complex nature of the terminal moraine of both the Eldridge and Ruth (Figure G-9.3) Glaciers is well delineated. Ford (1984) was also able to delineate glacial lakes, fluted ridges, and drumlinized topography along the valleys of the Chulitna and Tokositna Rivers. Figure G-9.3 is an oblique aerial photograph of the terminus, complex terminal moraine, and outwash plain of the Ruth Glacier, a valley glacier that originates on the southern flank of the Mt. McKinley massif.
Hall and Ormsby (1983) did a comparative analysis of a Landsat image (30177-20455, August 29, 1978) of the Alaska Range and the Seasat SAR image (03800083, July 23, 1978) analyzed by Ford (1984). They found that Landsat and Seasat SAR images were equally useful in determining the position of glacier termini, delineation of medial moraines, and depiction of the terminal moraine areas. Landsat images can be used to determine the snowline, but Seasat SAR images cannot. Landsat 30537-20443-7, August 24, 1979.
Continue to Plate G-10| Chapter 9 Table of Contents.| Return to Home Page| Complete Table of Contents|