
What evidence led to and supports the Big Bang model? Two accepted lines of proof have already been described: 1) the details of the creation and progressive emergence of various elementary particles during the first minute of the Big Bang; these are the outcome of a history that can be predicted and explained both by Relativity and Quantum Physics, that is, the theoretical production and sequence of particles (leading to the observed amounts of H, He, and Li) are consistent with a model based on Big Bang precepts; and 2) the observations, particularly from HST, of the farthest galaxies as being more primitive in appearance and development, i.e., in earlier stages of evolution since they are older, is precisely what is expected from the expansion model. But, even more convincing are two other physical observations that are best explained by a Big Bang origin for the Universe, especially in terms of its expansion behavior: redshifts of light from the stars as a composite source in galaxies and cosmic background radiation.
The first derives from relative velocities
as divulged by the measured redshift of radiation
wavelengths. This was discovered by V.M. Slipher in
1912 and then tied to cosmic expansion by the astronomer
Edwin Hubble in 1924. In fact, H. Robertson noticed
a bit earlier that the farther the galaxies were from
our telescopes, the greater was the redshift; but
Hubble normally receives credit for this redshift-velocity-distance
relationship because he included many more galaxies
as data points. Some of Hubble's observed shifts led
to estimates of galaxy velocities of 100 million kph,
about 0.1 the speed of light.
One manifestation of a wavelength shift's effect,
which can be experienced in everyday life on Earth,
is exemplified by an audible phenomenon: Recall the
sound of a whistle or horn on a fast-moving train
as it approaches and then moves past where you are
stopped at a crossing. The pitch of the sound varies
systematically, rising on approach and then falling
as the train recedes after passing. This wavelength
shortening (higher pitch) on approach and lengthening
(lower pitch) with recession is called the Doppler
effect, which results from velocity and/or position
changes (relative motions) between moving source and
stationary receiver.
As applied to the Universe, the wavelength shift
is known as the Cosmological Redshift. From
a relativistic standpoint, while Dopplerlike in its
effects, the cosmological redshift is analogous to
the "stretching" of light caused by the progressive
increases in distance resulting from the continuous
expansion of (curving) space. This in turn results
in proportional increases lin recessional velocities
(thus in the formula for velocity v = d/t, it is the
d that changes with respect to steady time progression)
with increasing distance from Earth (recall the rubber
band analogy on page Cosmo-4). (Note: there is also
a gravitational redshift effect in which the wavelengths
of radiation (light) lengthen during passage from
source to observer past massive perturbing bodies.)
As a star or galaxy emitting radiation recedes from
an observing (measuring) instrument (somewhere on
or near the Earth), a reference wavelength associated
with a particular line in the spectrum (commonly recorded
on a photographic plate showing multiple lines that
represent the spread of wavelengths characteristic
of all detected elements) for some given element in
the ground or an excited state in the visible will
be shifted (delta![]() /
/![]() )
towards the red (longer wavelength-lower energy end
of the visible spectrum) and even into the near infrared;
if instead the body advances towards the observer,
the shift will be towards the blue (shorter wavelengths).
For example, the Ca++ absorption line present
in a star's or galaxy's radiant (EM) emission is measured
at its observed (shifted) longer wavelength which
is then compared with the wavelength for the equivalent
line in its (rest state) spectrum obtained by exciting
the element on Earth in an emission spectrometer.
Since the redshift is velocity dependent, its magnitude
is a direct indication of the rate of recession, i.e.,
the larger the shift, the greater the velocity.
)
towards the red (longer wavelength-lower energy end
of the visible spectrum) and even into the near infrared;
if instead the body advances towards the observer,
the shift will be towards the blue (shorter wavelengths).
For example, the Ca++ absorption line present
in a star's or galaxy's radiant (EM) emission is measured
at its observed (shifted) longer wavelength which
is then compared with the wavelength for the equivalent
line in its (rest state) spectrum obtained by exciting
the element on Earth in an emission spectrometer.
Since the redshift is velocity dependent, its magnitude
is a direct indication of the rate of recession, i.e.,
the larger the shift, the greater the velocity.
To apply the redshift to estimate R (Scale Factor), the distances to the shifting bodies must be determined. Distance measurements obtained for nearby bodies, e.g., in our own Milky Way galaxy, can be made on visible stars whose magnitudes can be directly ascertained. One technique is that of parallax observations. While not fully explained here, the gist of this technique can be sensed by this simple experiment: Hold your index finger first about 6 inches in front of your nose and rapidly alternately close your left eye and then right one repeatedly. Your finger will appear to shift back and forth relative to a fixed background, perhaps seeming to displace several inches. Now, put your finger full out (about 24 inches) and do the same thing. Note that the displacement is now less. This is the parallax effect. The amount of shift decreases with increasing distance and that distance can be determined by simple trigonometry. As used to measure stars within about 100 parsecs (326 light years), the left and right eye positions are proxied by the positions at opposite points in the Earth's elliptical orbit six months apart. A star's apparent shift relative to distant background stars, even though proportionately much smaller than that of the finger experiment, is sufficient to provide an accurate distance measure for stellar bodies close to Earth.
Redshift measurements for more distant starlike bodies are actually made on galaxies (their individual stars may not be resolvable) whose luminosities are the average of all component stars. Approximate distances to host galaxies containing separable stars rely on determining the intrinsic luminosity of any Cepheid supergiant stars within them. Cepheids are among a group of stars of several types, first discovered in 1912 in the Magellanic Clouds, that show regular, pulsating variations in luminosity proportional to their pulse periods (the brighter the star, the longer its period). Cepheids flare up to peak brightnesses, then dim down, over periods of days. When Edwin Hubble plotted this cycle in 1924, he noted the relation that the longer the period, the greater is the increase in intrinsic brightness. Once absolute luminosity is calculated from this relation, the drop in apparent (observed) brightness from that value can then be reckoned as an inverse function of the square of the distance r (1/r2). The Cepheid variable star method works well out to a distance of 10 million light years. For galaxies farther away, other methods of measuring distances to them (such as the rich cluster- brightest galaxy indicator which gives usable approximations out to 10 billion l.y.) have been worked out and applied (they have varying degrees of accuracy); use of multiple methods applicable at different distances is called the Cosmic Distance Ladder.
The Cosmological Redshift z is given as: z
= (![]() rec -
rec -
![]() em)/
em)/![]() em = v/c, where
em = v/c, where ![]() em is the wavelength given out in the past
(then) at the emitting galaxy or star,
em is the wavelength given out in the past
(then) at the emitting galaxy or star, ![]() rec
is the shifted wavelength received today (now) at
the detector (on Earth), v is the recessional velocity
for the particular redshift (convertible to a recessional
velocity Vr) and c is the speed of light.
(The above equation applies to low to moderate z's
but for large z's a modified expression [not given
here] must be used instead.) Another relationship:
z = 1/R(tem) - 1 describes the redshift
in terms of the Scale Factor R pertinent to tem
which refers to the particular time when the light
was emitted . This relationship can also be cast in
the following way:
rec
is the shifted wavelength received today (now) at
the detector (on Earth), v is the recessional velocity
for the particular redshift (convertible to a recessional
velocity Vr) and c is the speed of light.
(The above equation applies to low to moderate z's
but for large z's a modified expression [not given
here] must be used instead.) Another relationship:
z = 1/R(tem) - 1 describes the redshift
in terms of the Scale Factor R pertinent to tem
which refers to the particular time when the light
was emitted . This relationship can also be cast in
the following way:
in which Dnow is the distance to the emitter when the light is received and Dthen refers to the distance in the past when light left the emitter.
We see a redshift (towards longer wavelengths) because the Universe had a different Scale Factor when the light left the emitter. The redshift is due to the relative expansion of space (increasing "D's" [for distance]) rather than actual speeding up of more distant galaxies. Look at the two circle drawing shown earlier on page Cosmo-4. Note the S like curl that represents part of a wavelength train. It has a shorter wavelength in the left circle; as the circle expands with its enlarged coordinates, note that the wavelength on the right is now longer.
Edwin Hubble indeed is recognized as the key individual behind the Expanding Universe model, from whence later came the Big Bang conception of its origin. (As an aside, the now famous term "Big Bang" was coined by Fred Hoyle, in a somewhat derogatory way, since he was long an opponent of expansion, preferring his Steady State Universe model.) Hubble noted that, as recessional velocities Vr were measured for stellar sources over a wide range of astronomical distances D, the plot of Vr/D disclosed a straight line relation whose slope has a value H, known as the Hubble Constant, named after him. (This constant of proportionality, in fact, may not be perpetually constant, i.e., may have had different slope values in past cosmic times, if models that require expansion rates to vary are correct.). This can be restated as Vr = HD. which says that the recessional velocity increases by the quantity H (in units of km/sec/Megaparsec) with increasing distance from any point in the Universe (e.g., Earth) selected as the observational base. This, the Hubble Law, is the fundamental statement of Big Bang expansion. It works best (gives a straight line) from plots of V versus r involving galaxies a few billion or less light years away; uncertainties as to the correctness of distances further out cause a scatter in the plot that suggest (or mask) some degree of non-linearity related to the cumulative effects of the curvature of space. The Law works best on observations supporting an open Universe.
Recent estimates of the present-day value of H have been as high as 50 to 100 km/sec/Megaparsecs (a parsec is 3.26 l.y). (In some expressions of H, megaparsecs are replaced by 1 million (106) light years; thus 75 km/sec/Mpc = 23 km/sec/106 l.y.) One goal of the Hubble Telescope is to better fix this value - essential to an accurate estimate of the Universe's age. That age for a Universe with flat expansion is calculated using the relation t0 = 0.67/H0 in seconds must be converted to years); for a spherical or hyperbolic universe, the age expression become: t0 = 1/H0 The lower the value of H, the larger is t0 and thus the Universe becomes older. From various HST and Earth-based observations, a cluster of values between 65 and 87 km/sec/Mpc are accumulating. The first reported HST-derived ages fell between 8-12 Ga, anomalously low compared with previously reported ranges of 12 - 18 Ga and especially troubling in that separate evidence indicates some distant galaxies to be older than 12 Ga.
Over the past 8 years, observational data analyzed by the HST Team whose prime task was to try to pin down the Universe's age using a better determined Hubble constant suggest these initial values are indeed too low. In May of 1999 the Team announced a current best estimate for the Hubble constant of 70 km/sec/Mpc and an age of 12 to 13.5 billion years. The age uncertainty represents an accuracy variation to within +/- 10% for the value of this constant. Their result depends on analysis of redshifts in 18 galaxies within 67 million l.y. from Earth; in these they have found up to 800 Cepheid variable stars which are the most reliable indicators of large distances. From the combined determinations for the 18 galaxies, this best estimate of expansion rate gives an increase in velocity of 256,000 km/hr (160,000 mph) for every 3.3 million l.y. farther out the stellar entity (galaxy or individual stars) is from Earth. Most astronomers are accepting this value but some (e.g., Alan Sandage and associates) dispute the conclusion, citing older ages according to their calculations. One consequence of this most recent age estimate is that the galaxy whose distance is said to be 13 billion l.y. (see page A- ) must lie near the observable edge of the Universe.
The critical factors determining the Universe's age are its overall density (mass and energy) and the value of the Deceleration Parameter (related to the Hubble Scale Factor), as discussed elsewhere on this page. These specify the rate of expansion which in turn reveals how long it takes for galaxies to get to the farthest reaches of observable space (i.e., the limits or horizon defined as the farthest bodies that have emitted radiation which has had time since the beginning of the Universe to travel to Earth's observing stations; this will be marked by the first vestiges of materials capable of emitting detectable radiation during the early moments of the Big Bang; so far, detectors covering optical and other spectral regions have not yet picked out these oldest sources, so the currently observable Universe presently is smaller than the total observable Universe).
The Hubble equation specifies that the fastest receding
objects must be farthest away. In an expanding Universe,
with all galaxies ultimately drawing apart from each
other, those progressively farther away must travel
at proportionately greater speeds, but at the same
rates in all directions, to preserve an overall uniformity
of spatial relations during these expansive movements.
As a general rule, the farther the lookback
time, the smaller was the size of the Universe at
such times, and the hotter and denser is the early
expansion status of matter and energy.
Because most galactic measurements made on distant
galaxies show red rather than blue shifts (the latter
are seen for mostly nearby galaxies moving towards
us [Andromeda is approaching Earth at ~360,000 kph]
or can be noted in individual spiral galaxies as one
arm moves towards Earth), this evidence for overall
(net) recession is the principal proof for the Big
Bang expansion model. The redshift is related to recessional
velocities (ratioed with respect to the speed
of light) by an exponential curve in which the velocities
rise rapidly towards infinity as that speed in approached.
Most measurements of z from less distant galaxies
afford numbers between 0 and 1 (for example, a z =
0.1 represents a distance of about 1 billion light
years). Farther out galaxies showing redshifts of
1.2 correspond to ages in light years of about 8 billion
years; HST has now observed many galaxies with z's
up to 2+; distant quasars, some about 10-11 billion
l.y away, have shifts of 3 - 4 or higher (at an observed
age much earlier in Big Bang time); the farthest found
to date is 13 billion l.y. from Earth. The most distant
sources yet detected have redshift z verging on 5
(reaching to about 90% of the speed of light) and
represent galaxies that formed in the first billion
years or so after the Big Bang. These often are quasars
that presumably grew from young (protogalactic) gas
clouds which at the time were emitting photons at
an observed temperature of ~3,000 K (referenced to
an idealized blackbody - one which completely absorbs
incident radiation of all wavelengths and acts as
a perfect emitter; at that temperature, the wavelength
signature peaks at ~1 µm, however, at higher
z values the actual blackbody temperatures can be
much higher, causing a peak in the ultraviolet).
Recessional velocities as a function of distance
of cluster galaxies from Earth as the observational
frame of reference can be calculated from the
Hubble equation and z values. Choosing a Hubble constant
that gives 15 Ga as the age of the Universe, a galaxy
recedes an addition 25 km/sec for each million l.y.
further out one looks through space. For a cluster
in the Virgo Constellation, at a distance of 78 million
light years, the recessional velocity is ~ 1200 km/sec.
For the Bootes cluster, at 2.5 billion l.y., the velocity
has increased to 22000 km/sec. Galaxies whose distance
in about 5 billion l.y., attain velocities approximately
one-third the speed of light (100000 km/sec). The
most distant observed sources (mainly quasars) reach
recessional velocities approaching light speed. The
same type of velocity distribution would be ascertained
at any other observational point (such as set up by
the distant galaxy "civilization" referred
to earlier) in the Universe.
As HST observations accumulate, it is becoming evident
that, with its resolving power, structure in galaxies
can still be made out out to about 4 billion light
years. Present evidence is that beyond a z value of
2.75 no spiral galaxies appear to exist. Those that
lie farther out seem to be ellipitical or commonly
"dismorphous" (no regular form). Since these are older,
this implies that spiral galaxies may not develop
until later in galactic evolution. Some of the earlier-formed
spirals have an extra arm compared with younger ones.
(Another mechanism can cause redshifts, namely, the
effects of gravity on radiation. This gravitational
redshift is a consequence of General Relativity.
When light leaves a massive gravitational source,
such as a White Dwarf, gravity causes a shift towards
a longer wavelength; conversely, light passing into
a huge gravitational field will undergo a blueshift.
This effect has been observed for light grazing supermassive
bodies, including Black Holes. Overall, the effect
is localized or confined to individual bodies, and
normally the shift is very small, so that even the
cumulative effects of light reach Earth from the outermost
reaches of Space are quite small compared with the
motion-induced Cosmological Redshifts related to expansion.)
Another solid proof for the Big Bang was the discovery
that cosmic background radiation (CBR) peaks near
the wavelength of 1 mm (1000 µm [micrometers])
which lies at the far IR/microwave boundary region
of the EM spectrum. This is the wavelength expected
from a radiant blackbody source whose temperature
is now 2.73 K. G. Gamow and his colleagues had first
predicted such radiation (their estimate of its peak
was at 5 K) in 1948. This photon radiation, inherited
from the original radiation (much hotter and therefore
then of much shorter wavelengths in the infrared)
released at the Big Bang and first evident after the
Decoupling Era, seems to be uniform and isotropic
throughout the Universe. The ~3 K value is consistent
with a predictive model that requires very energetic
high temperature radiation (mainly gamma rays, with
much shorter wavelengths) released early in the Big
Bang to cool drastically by thermodynamic expansion
within a Universe having at the least the presently
observed spatial limits. The extraction of a weak radio telescope signal (after
receiver noise was subtracted) in the microwave region
at 7.3 cm (4.1 GHz) was made in 1965 by R. Wilson
and A. Penzias (for which they received the Nobel
Prize; actually, a similar signal was first detected
in 1961 by E. Ohm, then verified by B.Burke, but not
connected to the CBR prediction), with its correlation
to cosmic background radiation then confirmed by R.
Dicke and his group at Princeton. This test, along
with the work by Hubble, the theory of General Relativity
by Einstein, the pioneering concepts of a primordial
singularity by Lemaitre, the Inflationary Model by
Guth, and supporting contributions by numerous cosmologists,
astronomers, physicists, and mathematicians, taken
together, make up the critical foundation concepts
that support and explain the Big Bang in its present
form. Further discoveries will likely lead to refinements
but the fundamental concept and the proper numbers
predicted from the general model now seem to be solidly
substantiated.
The value of satellites in this refinement process
is well illustrated by COBE (Cosmic Background Explorer),
launched in 1987. Earlier attempts by Smoot and others
to map the apparent non-variant (uniform) background
radiation over the entire sky using balloons and aircraft,
to make measurements above the atmosphere which blocks
out (absorbs) radiation in the .001 to 0.1 m region
of the spectrum, gave strong hints of radiation uniformity
but were subject to imprecision. With COBE, the mapping
process was greatly improved so that a detailed chart
covering the full sky was assembled in just a year.
COBE verified the high degree of uniformity of the
present background in all directions and also confirmed
that the general expansion is extremely uniform in
all directions. And, COBE took extremely accurate
readings over most of the wavelengths involved in
the blackbody curve determined experimentally for
a 2.7 K body, demonstrating that the background radiation
fits that curve at better than 99% accuracy (an astounding
achievement seldom attained in most scientific measurements).
COBE also allowed the mapping of radiation in the
early stages of the Universe to an accuracy such that
it showed variations in temperature and density as
slight as 1 part in 100000 during the first billion
years after time zero. The map below shows the broad
distribution of minute temperature differences across
the early Universe as detected by COBE's DMR (Differential
Microwave Radiometer) using data collected at 53 and
90 GHz. The blues represent slightly cooler and reds
slightly warmer temperatures - thus also define regions
of greater and lesser densities.
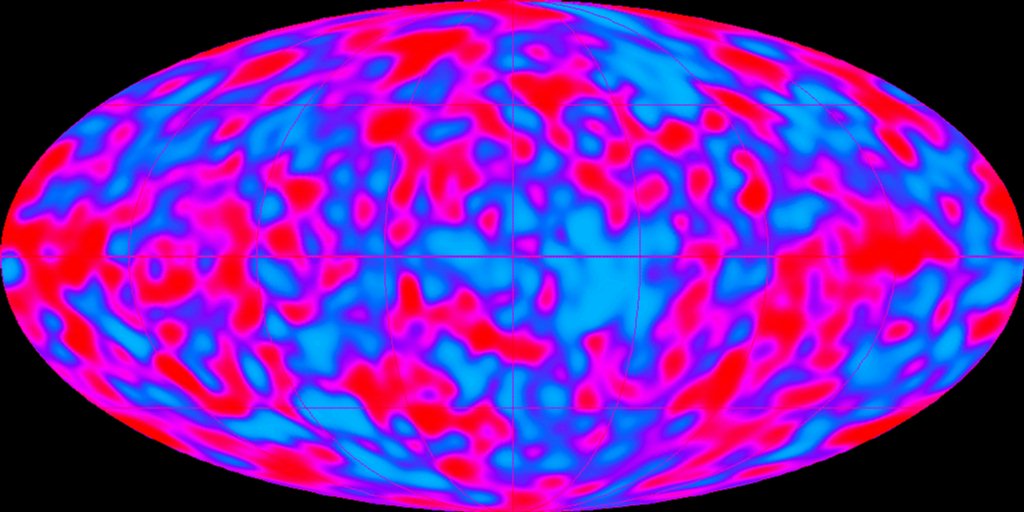
These small differences were, however, critical in allowing matter to break from the initial extreme uniformity into regions of slightly cooler, denser conditions where the protogalaxies could begin to form. Eventually, in the early Universe these seed fluctuations promoted localized clotting of particles that became gravitational centers whose growing attraction of more matter led ultimately to development of the billions of galaxies that populate the Cosmos as we now know it. The results from COBE proved of such import to understanding the early Universe, especially the small but critical fluctuations it detected, that a more sophisticated satellite, MAP (Microwave Anisotropy Probe), will be launched in the year 2000.
COBE has allowed an estimate of the total energy in the Universe by sampling
yet another part of the spectrum. This results from painstaking analysis of
radiation in the far infrared using the Diffuse Infrared Background Experiment
instrument onboard. This measures heating of the dust distributed throughout
the Universe, using windows at 140 and 240 µm. However, the overall background
is "contaminated" by dust and other sources within and around the
Milky Way, the Earth's atmosphere, and other sources, which require correction.
The procedure is indicated in this figure:
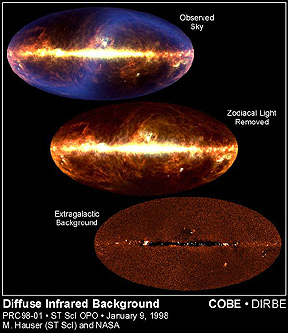
The upper panel shows a sky map of the infrared radiation for the whole Universe with a bright central band representing the Milky Way contribution. The central projection is the change after Zodiacal light is removed. The bottom panel is the residual infrared radiation for the Universe after the Milky Way Galaxy's influence has been removed. The net effect is that there is much more starlight in the Universe as "fossil radiation" than heretofore suspected owing to the masking by dust (ranging from near-Earth to intergalactic) whose influence is now accounted for with this corrective DIRBE inventory.
A recent announcement from Hubble scientists carries this background concept
into the visible radiation realm. Based on estimates of quasar populations at
the farthest reaches of observable space (the Deep Field region), extrapolations
of visible light sources to the entire Universe can be made. Results suggest
that most of these sources are now accounted for and that the total amount of
visible light which persists throughout the Universe is approximately of the
order to be expected (by calculation) from the same model that predicts the
amount of Cosmic Background Radiation. In other words, as different parts of
the EM spectrum are analyzed for total energy involved, the numbers remain consistent
with expectations and thus support the energy distribution predicted from the
Big Bang model. The overall notion of an expansion appears on firm ground
based on the ever accumulating scientific evidence. The expansion of the Universe from a relativistic framework (implied above
but not specifically developed from that viewpoint) can be summarized as the
Friedmann equation. We give it here in two forms, the first as a differential
equation:
And the second:
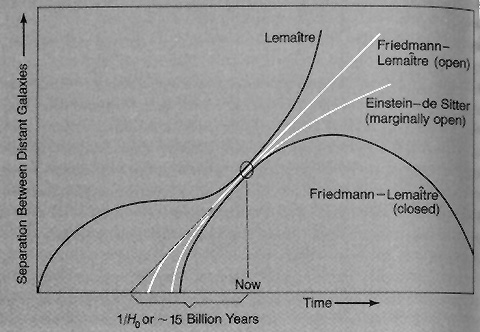
Several cosmological scenarios, named after the scientist(s) who first proposed each (several scientists came up with more than one model), for various modes of expansion lead to different end results (shown graphically below for four models).
In common, they all obey the Cosmological Principle, which states that the Universe is both homogeneous and isotropic (essentially the same average distribution of matter/energy in all directions) on the largest scales (this is not violated at the scale of galaxy clustering since at the universal scale these tend to be "smoothed out" by having much the same patterns anywhere one looks). Open models also must be consistent with the restriction placed by the Second Law of Thermodynamics which from a cosmological standpoint states that over time the entropy (a measure of disorder of a system) must ultimately increase to (or towards) a maximum (total disorder); interpreted at a universal scale this would lead to complete dispersal of galaxies and their stars (perhaps rearranged as randomly distributed Black Holes) and blackbody temperatures approaching zero. A corollary holds the initial singularity to have minimum entropy which then rapidly increases during the first moments of the Big Bang.
The following table summarizes the principal Cosmological Models that have been developed and tested by calculations. They fall into two groups: the standard (Friedmann) models in which the Cosmological Constant L (see below) is not a factor (i.e., is 0) and models in which it is; the three standard models also have Deceleration Parameters q (defined below) that include the value 1/2 in some way.|
|
|
|
|
|
| Einstein | Spherical | Lc | 0 | Unstable: collapse or expand |
| de Sitter | Flat | >0 | -1 | Exponential expansion |
| Steady State | Flat | >0 | -1 | Exponential expansion |
| Lemaitre | Spherical | >Lc | <0 | Expand; hover; expand |
| Negative L | Any | <0 | >0 | Big Crunch |
| Closed | Spherical | 0 | >½ | Big Crunch |
| Einstein-de Sitter | Flat | 0 | ½ | Expand forever |
| Open | Hyperbolic | 0 | 0<q<½ | Expand forever |
L = The Cosmological Constant: introduced by Einstein to his field equations for General Relativity in order to provide some constraint to gravity (a counter-effect) to avoid an inevitable collapse of the Universe; if + (repulsive) L counteracts gravity; if - (attractive) L augments gravity. Lc is one particular number known as the critical value. L may be equivalent to the vacuum energy density associated with particles at the quantum level. (L in texts is given by a capital Greek letter which cannot be reproduced with the .html editor being used.)
q = The Deceleration Parameter: denotes the rate of change with time of the Hubble Constant.
Considering all of these models : If the Universe is open or flat, the Universe will expand infinitely but at different rates depending on the parameters associated with each model. (Hyperbolic space is one that has negative constant curvature: although difficult to visualize, and best described mathematically, descriptively it has been likened to a horse's saddle which has the peculiar spatial attribute of the lowest point on it going both "downhill" and "uphill").The closed and negative L models, in contrast, predict finite expansion followed by eventual contraction and thus at some time the Universe returns to a singularity state. For each of the models, the expansion geometry and the behavior from the onset (the Steady State model has no "beginning") to its eventual fate (Crunch; Expansion) depends ultimately on the matter density that characterizes it. If the density is less than the Critical Density, space is hyperbolic; if greater than critical, spherical and closed; and if equal to critical, space is flat (at least at the scales we observe it).
The first five models are all non-standard and were devised when Einstein's Cosmological Constant seemed to have some essential validity. Each of these models fits at least some of the general observations of the Universe but failed on other accounts. Einstein himself spent many years in calculating properties of such Universes but eventually abandoned the concept of a counter-gravity force, admitting it was his "biggest mistake" in his scientific reasoning. Evidence for this Constant is still lacking but in recent years variations of it are again becoming fashionable to explain some of the phenomena essential to a changing Universe. Its possible equivalence to the concept of vacuum energy density may have been a key factor in the Inflationary Stage of the early Universe; a rapid increase in L (the Lambda-force) could be the driver behind the tremendous expansion then but that increase had to be short-lived and L must revert towards zero or the Universe would have long since "blown" away.
The Einstein Universe is a static one, with spherical geometry, developed by this great scientist as an attempt to apply General Relativity to Cosmology. The idea of the Big Bang had not yet captured the attention of cosmo-scientists. In order to keep the Universe "going" instead of collapsing under its own gravity, Einstein invented his constant L to balance the attractive forces. While now considered notably incorrect, this model stimulated others to propose variants that incorporate expansion. The de Sitter Universe is a strange one, being empty and never undergoing a Big Bang. Its value of q being negative (-q) denotes an accelerating Universe. But in working back towards time zero, its representative R(t) value never attains zero, which means that it has no beginning, i.e., has an infinite past. While theoretically interesting, the model defies most observational parameters. The Steady State Universe was formulated by Hoyle and others as an "antidote" to the Big Bang model. It accepts expansion and implies that the Universe has no beginning or end. In order to preserve the matter density distribution determined for the Universe, Steady State requires a "creation field" in which new matter (mass) must be continuously created through time to balance the rate of expansion. Another model (not in above Table) also does not start with a Big Bang; this, the Eddington-Lemaitre model, is closed and finite and is static initially but thereafter starts expanding when the galaxies begin to form by hydrogen gas condensation. The Lemaitre model, derived from the Big Bang concepts, begins with a rapid increase in R during the early Universe but then experiences an extended period when R(t) remains nearly constant (owing to the effect of L being greater than Lc) so that expansion is minimal ("hovers") until much later resuming at an accelerated rate. Lemaitre was the first to consider the starting state to be one of extremely high (approaching infinity) density (he called the singularity a "primeval atom"; Gamow applied the Greek word "ylem" [primitive matter] to everything contained in such a singularity).
Among the three standard hot (high temperature) Big Bang models, the Open Universe model (also known as the Friedmann-Lemaitre model) predicts that expansion continues forever at an essentially constant rate through an infinite and unbounded space based on hyperbolic geometry (in which light can follow both positive and negative curvature simultaneously). Evidence so far suggests that a (nearly) flat Universe model, whose density is at the critical density (a geometrically-controlled distribution of matter that causes the Universe to expand forever even as it endlessly slows down) accounts for many of its observed properties, so that the Einstein-DeSitter Universe is currently the model most widely held to approximate reality. ("Flat" may be somewhat illusory: just as the surface of a large balloon may appear flat to an ant at some point on it, so the Universe may in fact be spherical but acts as though flat within the region open to our direct observation.)
Closed Universes follow spherical geometries. The prime model shows maximum expansion in early cosmic time (this is not the same as the incredible but brief expansion almost at the very beginning of the Universe if inflation indeed is a real phenomenon) with decreasing rates of augmentation thereafter. The rate of separation between galaxies diminishes with time until, at some future time, expansion ceases and galaxies then draw closer at ever faster rates until all matter and radiation converge to a singularity (perhaps 50 b.y. in the future), undergoing what has been called the Big Crunch. This raises the possibility of Repeated Universes, as singularities explode, expand, ultimately contract to the next singularity, and then repeat the cycle indefinitely, or, even infinitely; however, this scenario seemingly would violate the entropy restriction in that the singularity should have a minimum rather than maximum state of disorder that is the outcome for every model. Multiple Universes that evolve simultaneously are a possible consequence of the Chaotic Inflationary model which in recent years has gained favor as a variant of the inflationary version of the Big Bang; these Universes, however, have no likelihood of contact with one another, so that their existences may be unprovable.
Whether the present Universe is open or closed is still being debated. The key factor is the mass density of in the Universe. If this amount lies below a critical value, then gravitational forces will be insufficient to finally halt the expansion that would eventually result in all matter throughout space being pulled back into closure; in the open case, expansion is forever in (apparently) the one and only Universe. As of now, inventories of mass within the Universe have come up way short of the amount needed to maintain a closed Universe but with further observation and experimentation the gap is narrowing. The missing mass (and energy particles that have mass) may exist as dark (non-luminous) matter and/or as neutrinos, both currently difficult to detect and thus count quantitatively; some estimates hold the shortfall in accounted for mass to be as much as 90-95+%. This means that most of the matter in the Universe presently remains invisible to detection so far on Earth (the billions of luminous galaxies, each with billions of stars therefore make up only a tiny fraction of the Universe's total mass).
This humongous amount of dark matter is postulated by inferences drawn from observed effects; indirect evidence comes from the behavior of galaxies and galactic clusters which seem to need this superabundance of mass to account for their stabilities and motions. For example, the velocities of stars in outer spiral arms is much greater than predicted from the Newtonian 1/r2 force law, implying excess external mass. Another line of evidence comes from the gravitational lens effect - much more mass than observable is needed to account for the degree of bending of space as predicted by General Relativity. This is revealed by a greater curving of light from more distant light sources (therefore displaying larger displacements than expected) than would be caused only by the mass of the specific galactic cluster whose gravitational influence is being tested. Another sign of concentrations of hidden mass relates to directional movement of galaxies near enough to observe and measure this motion. Close to home, our Local Group (including the Milky Way) of galaxies is moving through space in the direction of the Constellation Centaurus at greater than expected velocities, under the influence of an invisible mass concentration dubbed "The Great Attractor."(by itself, the Milky Way is moving at about 2.1 million km/hr towards the region around the Constellation Leo). Also, huge masses of glowing gas whose molecules are rapidly moving and hence indicate very high temperatures have been detected; being very hot, they should fly apart but clearly are holding together, indicating the attractive action of great quantities of invisible mass.
Much of the missing mass may be tied up in Black Holes; billions probably exist throughout the Universe, and many, if not most, of the galaxies have Black Holes in their central cores. A Black Hole, with immense mass and a size estimated to be more than 2.5 million Sun diameters has been verified at the center of the Milky Way, around which the inner stars revolve about the Hole at speeds up to 3 million km/hr as they spiral inward to eventually be sucked in (by comparison, the Sun orbits around the galactic center at ~790,000 km/hr and the Earth around the Sun at ~108,000 km/hr).
The composition of dark matter is still speculative. Some is probably MACHOs (for MAssively Compact Halo Objects), consisting of baryons (protons, neutrons) and other matter in the non-radiating dark halos now known to distribute around galaxies and in intergalactic space. These are found principally in slower moving Cold Dark Matter (CDM). Dwarf galaxies and white and black dwarf stellar remnants - too small for ready detection in more distant space - may abound in this material. Black Holes and Neutron stars, undetectable by visual means but identified by their gravitational effects on nearby visible stars, also make major contributions. The bulk, however, occurs in Hot Dark Matter (HDM), probably in the form of fast-moving WIMPs (Weakly Interacting Massive Particles) - elusive matter/energy that does not interact with electromagnetic (EM) or strong nuclear forces. One WIMP type is the neutrino whose existence has been proved but whose mass -tiny but real - has just been verified - a determination that could account for much (most?) of the "missing" Universe mass. A recent announcement (June 1998) by a Japanese-American research team may dramatically change the role of neutrinos in the mass balance sheet. Using a deeply buried detector and a huge array of detectors, they have been able to capture light signals set off by neutrinos that disclose these extremely small particles to have an infinitesimally minute mass, about one ten-millionth that of the electron. But, because of the extremely large population of neutrinos throughout the Universe (like the Cosmic Background Radiation, they too are a residue of the Big Bang, being especially produced in abundance during the first few minutes when protons were being fused into deuterium and helum nucleii releasing energy as neutrinos), the cumulative mass of these particles may make a sizeable contribution to the inventory of missing mass. Some other theoretic WIMP(s) may exist but remain to be discovered (either from future particle accelerator experiments or from still to be built, more sensitive space detectors).

Collaborators: Code 935
NASA GSFC, GST, USAF
Academy
Contributor Information
Last Updated: September '99
Webmaster: Bill Dickinson Jr.
Site Curator: Nannette Fekete
Please direct any comments to rstweb@gst.com.