
Electromagnetic Spectrum: Spectral Signatures
For any given material, the amount of solar radiation that reflects, absorbs, or transmits varies with wavelength. This important property of matter makes it possible to identify different substances or classes and separate them by their spectral signatures (spectral curves), as shown in the figure below. *
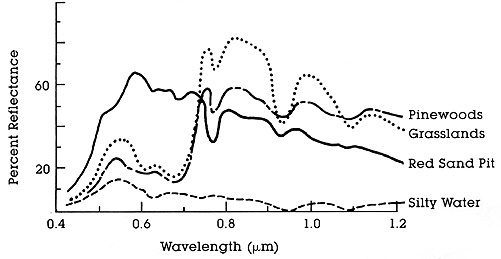
For example, at some wavelengths, sand reflects more energy than green vegetation but at other wavelengths it absorbs more (reflects less) than does the vegetation. In principle, we can recognize various kinds of surface materials and distinguish them from each other by these differences in reflectance. Of course, there must be some suitable method for measuring these differences as a function of wavelength and intensity(as a fraction of the amount of irradiating radiation) Using reflectance differences, we can distinguish the four common surface materials (GL = grasslands; PW = pinewoods; RS = red sand; SW = silty water), shown in the next figure. Please note the positions of points for each plot as a reflectance percentage for just two wavelengths (refer to figure below).
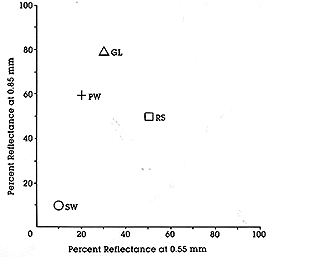
When we use more than two wavelengths , the plots in multi-dimensional space tend to show more separation among the materials. This improved ability to distinguish materials due to extra wavelengths is the basis for multispectral remote sensing (discussed on the following page).
I-11: Referring to the above spectral plots, which region of the spectrum (stated in wavelength interval) shows the greatest reflectance for a) grasslands; b) pinewoods; c) red sand; d) silty water. At 0.6 micrometers, are these four classes distinguishable? ANSWER
I-12: Which material in these plots is brightest at 0.6 micrometers; which at 1.2 micrometers? ANSWER
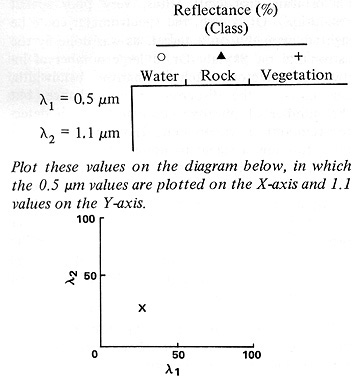
I-13 Using these curves, estimate the approximate values of % Reflectance for rock (sand), water, and vegetation (choose grasslands) at two wavelengths: 0.5 and 1.1 micrometers, putting their values in the table provided below. Then plot them as instructed on the lower diagram. Which class is the point at X in this diagram most likely to belong? (Note: you may find it easier to make a copy of the diagram on tracing paper.) ANSWER
I-14: Presume that two unknown surface features in an image or photo, which actually are a forest and a field crop with the plants close-spaced, are measured for their spectral values, and both display quite similar reflectances at three chosen wavelengths. How might these be separated and perhaps even identified? (Hint: think spatially.) ANSWER
____________________________________________________________
* The subject of spectral curves or plots and the principles of spectroscopy in general, as well as a survey of imaging spectroscopy and hyperspectral remote sensing, are explored in greater detail in Section 13 (pages 13-5 through 13-10).

Collaborators: Code 935 NASA GSFC, GST, USAF Academy Webmaster: Bill Dickinson Jr.
Primary Author: Nicholas M. Short, Sr. email: nmshort@epix.net
Contributor Information
Last Updated: September '99
Site Curator: Nannette Fekete
Please direct any comments to rstweb@gst.com.