Hydrologic Applications: Snow Cover and Flooding
These views of frozen water carry us naturally into the last topic - hydrology - in this section. In this context, hydrology refers of water distribution and management on land surfaces. We discuss here two of the three principal uses of satellites for hydrologic applications: runoff prediction and flood monitoring/damage assessment. The third topic - drainage basin characterization - we do not consider.
Obviously, metsats can provide near real-time indications of weather conditions that portend severe storms and heavy rainfall. Over a longer period, satellite imagery can show potential flooding from spring thaws and image interpreters can estimate expected quantities of water runoff by monitoring snow cover over large regions. Satellite observations of surfaces blanketed by snow (in the U.S. principally in mountains and high prairies) suffice to measure the areal extent of the masses likely to melt. We illustrate seasonal variation in snow cover from year to year by this pair of Landsat-1 images of the central Sierra Nevada highlands.
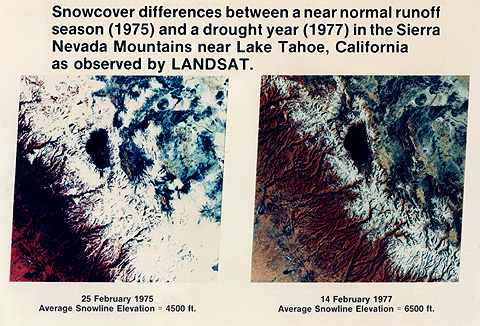
However, we must determine thickness variations and packing densities from onsite ground measurements, in order to estimate the volume of runoff. This information is important not only for flood warnings and control but also to estimate water supply from reservoir fillings, river channeling, and aqueduct retrieval.
14-39: Make an estimate, using the above Landsat image pair, of the amount of increased water one could get from the melting of the 1975 snowpack in the Sierra Nevada compared with 1977, assuming the snow is melted entirely. ANSWER
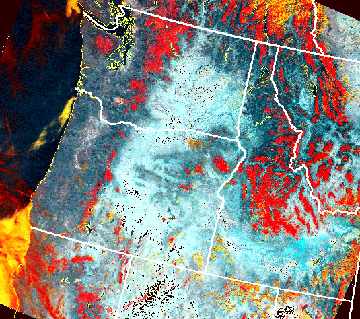
We use images from the NOAA and the GOES satellites routinely to determine the extent of snow cover. We can separate snow from clouds by differences in spectral absorption in longer wavelength bands. Both are highly reflective in the visible and photographic IR. The Thematic Mapper band 5 also can distinguish snow/clouds, and thermal responses vary, as well. Here is a color composite made from three NOAA-12 AVHRR bands (1,3,4 = RGB) showing snow in April 1995 in the northwestern U.S. as red:
Major snow storms can cause heavy cover that leads to extensive flooding, if a rapid thaw occurs. Look at this GOES-8 coverage (top, below) of a massive storm that hit the northeastern U.S. on January 7, 1996. The bottom image taken after storm passage and return of clear skies shows the extent of snow cover.
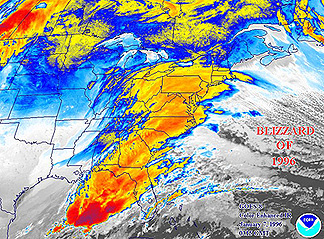
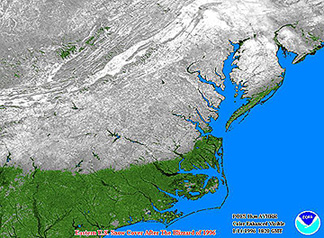
Its damaging effects struck home with the writer very quickly. A combination of ice, followed by more than 50 cm (20 in) of snow, and then a rapid thaw led to basement flooding in his house (located on the side of a hill, away from any floodplain). While the above images didn't play a role in this instance, it was almost "comforting" to see afterwards how violent this storm was and how vast its snow output.
14-40: Below (south) of the edge of the snow cover, the land is shown as green. What happened to it during the storm? ANSWER
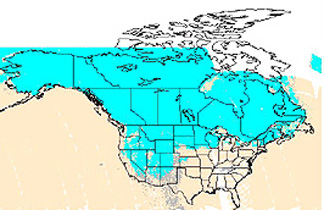
The National Weather Service keeps an up-to-date map of snow cover for the U.S. as shown here for March 9-12 of 1997. This map encompasses areas with snow but not every part of the blue actually has a cover.

Primary Author: Nicholas M. Short, Sr. email: nmshort@epix.net
Collaborators: Code 935 NASA GSFC, GST, USAF Academy
Contributor Information
Last Updated: September '99
Webmaster: Bill Dickinson Jr.
Site Curator: Nannette Fekete
Please direct any comments to rstweb@gst.com.