
Geostationary Satellites
We switch now to consider the second general class of metsats: those in geosynchronous orbit (refer to page14-5). Most imagery shown on TV News Weather segments comes from these satellites. Launched on December 7, 1966, the first such satellite was the Applications Technology Satellite-1 (ATS-1), which employed the Spin Scan Cloud Camera (SSCC) to obtain visible images of the western hemisphere. The value of synoptic coverage over short time spans was quickly proven by images such as these:
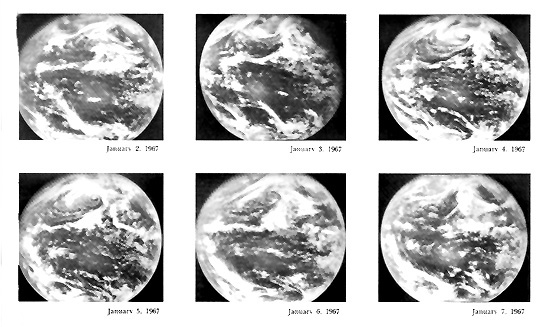
14-16: Comment on at least one mega-weather pattern in the northern and in the southern hemispheres as time progresses from January 2 through the 7th. ANSWER
Rapid improvement in vidicon technology led to the first color system, the Multicolor Spin Scan Cloud Camera (MSSCC), on ATS-3 (launched November 5, 1967), producing striking portraits of entire continents such as this view of South America:
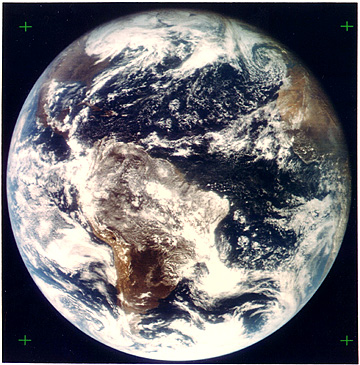
14-17: Is that a hurricane at about 1:00 o'clock in the hemisphere, off the Spanish coast? ANSWER
The beginning of an operational system dates to May 17, 1974, with the launch of the first of two Synchronous Meteorological Satellites (SMS). Each SMS carried, as its principal sensor, the Visible Infrared Spin Scan Radiometer (VISSR). These were predecessors to NOAA's Geostationary Operational Environomental Satellite (GOES) series-the kingpin of present day geosynchronous systems, covering the western hemisphere. Here is an artist's drawing of the GOES-8 spacecraft:
GOES-1 arrived in a geostationary orbit at 135° W, soon after its launch on October 16, 1975. Others launched at two to three year intervals (coincidentally, GOES-10 entered its orbit on April 25, 1997, the same day the author wrote this paragraph). We refer to the satellites covering the Atlantic Ocean and the eastern U.S. as GOES-East, and those over the Pacific as GOES-West). Again, VISSR is the chief sensor, but sounding (VAS is the VISSR Atmospheric Sounder) capabilities are also onboard. Starting with GOES-8 (April 13, 1994), the VISSR operates all of the time, rather than providing periodic views.
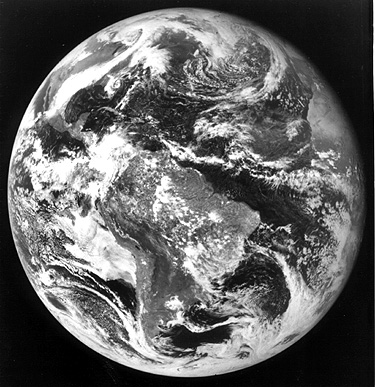
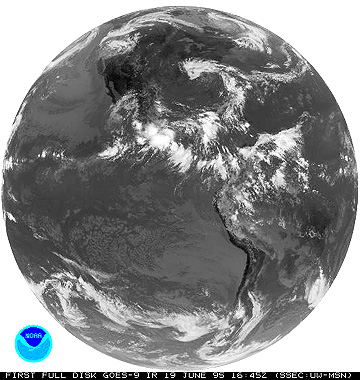
To exemplify GOES imagery, we now show the first visible image (top) from GOES-1 on October 26, 1975 and the first IR image (bottom) from GOES-9 on June 19, 1995:
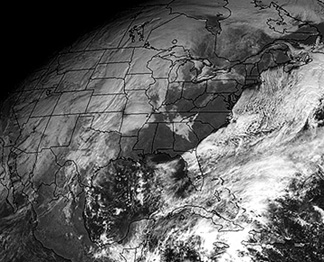
We can subdivide these hemispherical images to concentrate on specific areas. Here are two GOES-8 (East) images: the top one focuses on a large continental storm on March 20, 1994, whereas the bottom one shows a front passing off the Atlantic coast on November 27, 1996:
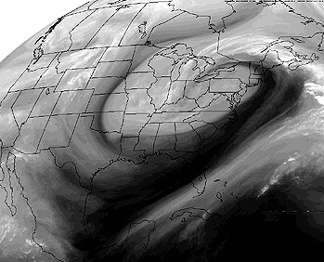
14-18: The March 20th storm shown in the upper of the two images just above resulted in a huge snowfall over its northern segment. The cloud pattern resembles a hurricane but there are differences. Mention several of these. ANSWER
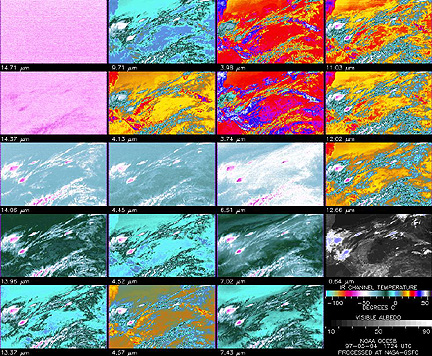
The GOES-8 sounder has a visible band and 18 thermal bands, which are sensitive to temperature variations related to CO2, ozone, and water vapor at different atmospheric levels. We can convert each band into an image, to which we assign colors, to identify thermal differences, as demonstrated in this panel of images taken on May 5, 1997.
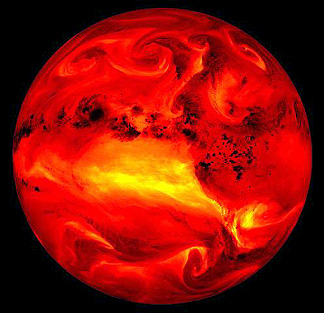
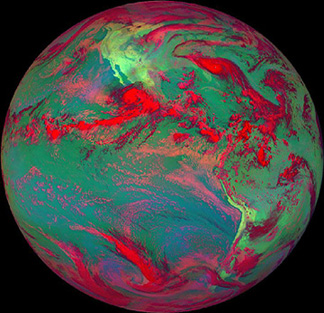
We can make unusual color composites from different channel images. On the top is a colorized rendition of the 6.7 µm channel image from GOES-8, which is sensitive to water vapor distribution, highlighting a big U.S. storm on March 20, 1994. On the bottom is a false color image made from the 6.7 µm = blue; 11 µm = green; visible = red. This GOES image displays Hurricane Hugo, as seen on September 21, 1989.

Primary Author: Nicholas M. Short, Sr. email: nmshort@epix.net
Collaborators: Code 935 NASA GSFC, GST, USAF Academy
Contributor Information
Last Updated: September '99
Webmaster: Bill Dickinson Jr.
Site Curator: Nannette Fekete
Please direct any comments to rstweb@gst.com.