ERBS; UARS; ADEOS
Similar to some of the first metsats, several U.S. missions in the past 14 years performed atmospheric/climate research, primarily. On October 5, 1984, the Earth Radiation Budget Satellite (ERBS) went into a non-synchronous orbit that permitted sampling at various times of day. The ERBS consisted of two instruments: a scanner and a non-scanner, designed to measure diurnal variations of incoming solar radiation and its differential absorption by the atmosphere. The latter had five broadband channels, one looking sunward, and the others at Earth, over wavelength intervals of 0.2-5.0 µm. The scanner's three channels performed similar functions. The ERBS also carried Stratospheric Aerosol and Gas Experiment II (SAGE-II), a limb sounder, which used four bands (0.385, 0.45, 0.60, and 1.0 µm) to measure aerosol and Rayleigh (fine-particle) scattering, whenever the satellite could view sunrise and sunset in its orbit. The next image is an ERBS determined, long-wavelength, radiant-flux density during 1985-86. We show on the bottom, aerosol concentrations over a period of six weeks, during summer 1991, as measured by SAGE-II. Note: these instruments flew on other satellites, including two in the NOAA series.
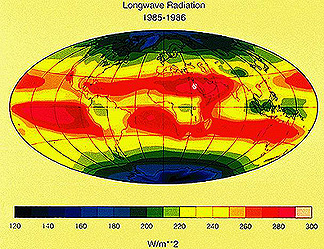
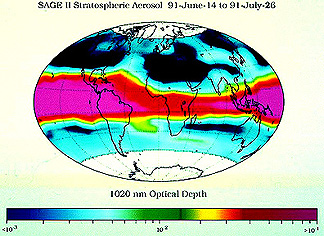
14-22: What were ERBS and SAGE actually measuring? ANSWER
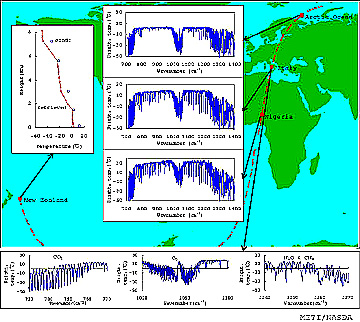
The Upper Atmosphere Research Satellite (UARS) deployed from a Shuttle (STS-48) on September 12, 1991, with ten instruments including the Microwave Limb Sounder (MLS ), the High Resolution Doppler Imager (HRDI), and the Improved Stratospheric and Mesospheric Sounder (ISAMS). In the next images, on top, are plots of the distribution at the south pole of chlorine monoxide (ClO) and nitrogen dioxide (NO2), in terms of predictive models and actual results from the MLS and Cryogenic Limb Array Etalon Spectrometer (CLAES). On the bottom is a CLAES plot of methane (CH4) distribution through the atmosphere along a specific orbit.
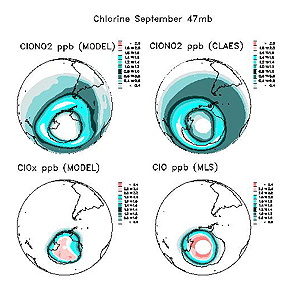
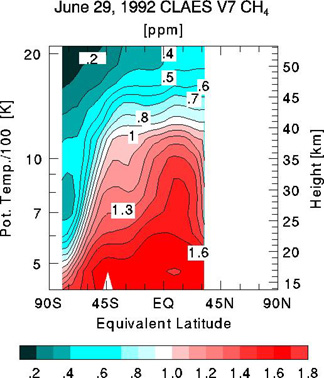
14-23: Where does the methane (CH4) concentration appear to be maximum? Speculate on why. ANSWER
The Advanced Earth Observation Satellite (ADEOS) is a Japanese spacecraft, launched on August 17, 1996, to conduct land, sea, and atmospheric studies using ten instruments supplied by NASA, NOAA, NASDA (Japan) and CNES (France). It is now becoming common to piggy-back sensors from several nations on a given satellite. Among these sensors are a NASA Scatterometer (NSCAT) and TOMS. Next, we show examples of sounder plots using instruments supplied by two Japanese agencies: the Interferometer for Monitoring of Greenhouse gases (IMG), which looks at absorption bands for CO2, CH4, H2O, O3, and NO2 in a 0.715-2.0 µm channel, CO in a 2.0-2.5 µm channel, and CH4 in a 2.32-3.05 µm channel; and the Infrared Limb Atmospheric Spectrometer (ILAS), which examines ozone distribution.
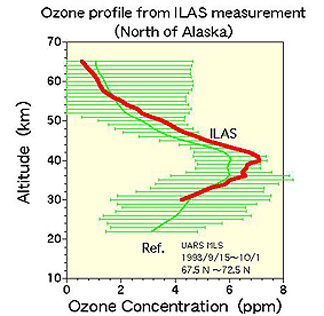
14-24: Is it reasonably safe to fly in a jet with respect to ozone as a contaminant? What are the horizontal green bars in the right diagram? ANSWER

Primary Author: Nicholas M. Short, Sr. email: nmshort@epix.net
Collaborators: Code 935 NASA GSFC, GST, USAF Academy
Contributor Information
Last Updated: September '99
Webmaster: Bill Dickinson Jr.
Site Curator: Nannette Fekete
Please direct any comments to rstweb@gst.com.