
"Global change". "Greenhouse effect". "Global warming". The media are full of statements, concerns, guesses, and speculation about these phenomena, as scientists and policy-makers around the world struggle to address recent scientific observations that indicate human activities impact our environment. And yet, each of these is a "natural" phenomenon, as are many others. Hurricanes, droughts, and monsoons all occur without any control by humans, to initiate, forestall or moderate them.
We can learn about our planet's interacting physical systems by observing the results of such natural phenomena, and use our knowledge to explore human-induced changes. Consider, for example, the eruption of a volcano, such as Mount Pinatubo in the Philippine Islands in 1991, that happened without human intervention. This volcano had been dormant for more than 600 years.
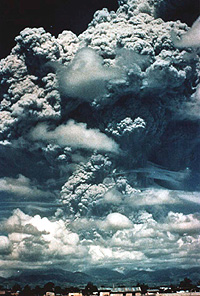
When a volcano erupts it spews millions of tons of ash, debris, and gases into the atmosphere, not to mention the lava flows from some volcanoes. Because of the presence of instruments–on the ground, at the ocean's surface, and in space–we observed a cloud of sulfur dioxide (SO2), emitted by Pinatubo, make its way westward, extending well past India within twelve days of the original eruption. By three months, that cloud had completely encircled the Earth, as shown from space (below), and inside of a year SO2 particles in the atmosphere were providing gloriously-colored sunsets all over the globe and lowering global temperatures, as well. Clearly, an erupting volcano impacts more people and places than just within its immediate vicinity.
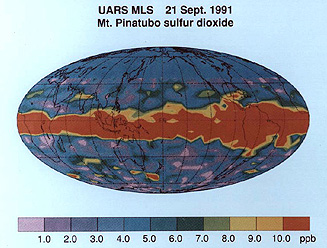
16-4: Why does the Pinatubo ash tend to stay confined to a wide equatorial zone? ANSWER
Mt. Pinatubo offers a stellar example of how monitoring from space can continually update the status of transient ground events (that, in unpopulated areas [not the case in Luzon] may go unnoticed. Below are two SIR-C radar color composites (L-Band HH = red; L-Band HV = green; C Band = blue) taken in May (left) and September (right) of 1995 , both showing the effects of the 1991 eruption. Ash from that event appears in red.
16-5: There is one noticeable change in the right radar image. Find it. Make a guess as to its cause (clue: the volcano didn't erupt between May and September of 1995). ANSWER
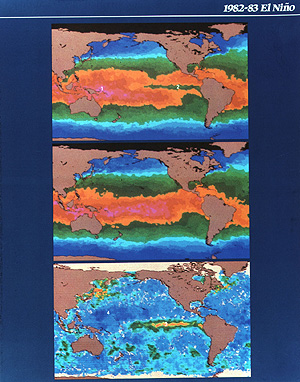
Another fascinating example of a natural phenomenon, we know as El Niño, because it occurs with some regularity (although not complete predictability) around Christmas time. El Niño refers to the baby Jesus, whose birthday we celebrate at the end of December. When an El Niño occurs, a pool of warm water from the western Pacific Ocean moves eastward to the western coast of South America. In the process, weather patterns around the world changes often to the detriment of human populations–as do South American fish populations. In non-El Niño years, fish are abundant in this region, because of the cold, nutrient-filled waters. When an El Niño occurs, that cold water flows deep into the Pacific, and fish populations decline dramatically, with concomitant effects on humans whose livelihood depends on those fish.
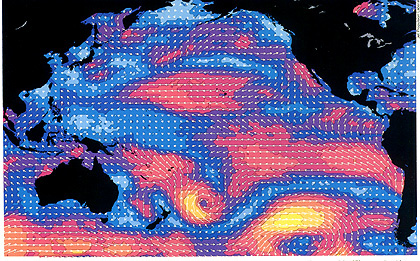
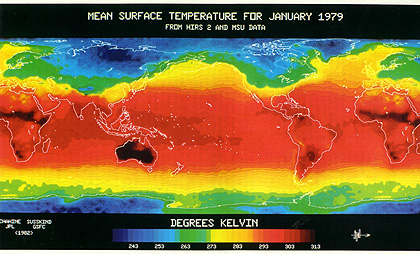
Other such phenomena abound. Some are readily observable by space sensors, particularly meteorological and oceanographic measurements (see Section 14). As examples, consider these near-global plots. The left from comes from the Seasat Radar Scatterometer and shows prevailing wind patterns over the oceans at supercontinental scales. The right one depicts the mean day, night, and day-nite temperatures of the Earth's land and sea surfaces, averaged for January of 1979, from Nimbus 6, High-resolution Infra-red Sensor (HIRS), 3.4 and 4.0 mm channels, integrated with MSU microwave and infrared data. Suffice to say that even without human contributions Earth is a dynamic system, one that changes routinely and often drastically.
In addition to the observed phenomena described above, scientists have accumulated other relevant, environmental recordings. For example, levels of several trace gases in our atmosphere have been rising and continue to rise. One of these, carbon dioxide (CO2) has been increasing since the middle of the last century, after many, many years of essentially stable levels. Why is this? A simple explanation is that the Industrial Revolution began at about the time these increases started. With that social upheaval, came the use of biomass and coal for fuel to support these new industries. Burning such material generates CO2.
Other trace gases have been rising, as well. Methane (CH4), from rice paddy production and enteric fermentation, is increasing, as are chlorofluorocarbons (CFCs) that have been used for many years as a refrigerant and to produce foam.
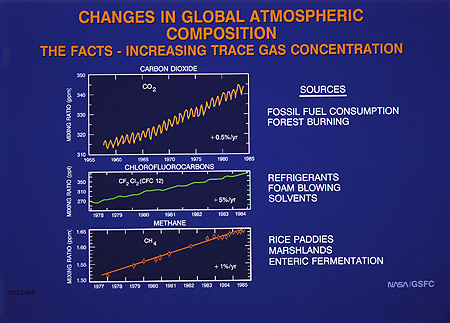
16-6: The carbon dioxide curve shows regular oscillations (much like a sine curve). Why? With what do these three curves best correlate? ANSWER
These gases contribute to the greenhouse effect that is warming our atmosphere to the levels we now record. The greenhouse effect results from the trapping of solar radiation that reflects from the Earth’s surface by these (and other) gases. The atmosphere is essentially transparent to incoming solar radiation. After striking the Earth's surface, the wavelength of this radiation increases as it loses energy. The gases we discussed are opaque to this lower energy radiation, and therefore trap it as heat, thereby increasing the atmospheric temperature. As these gases increase, due to natural causes and human activity, they enhance the greenhouse effect, and may raise temperatures even more. If the climate warms, the vegetation belts will tend to move northward, changing global ecological and biome patterns. Other effects may be discerned in precipitation patterns, sea level changes, and more.
Clearly, global mean annual temperatures are rising, and we continue to monitor this condition with space observations to help settle the question: how much is just a natural trend (e.g., inevitable interglacial warming) and how much is due to man's activities? Scientists need to establish a long-term data base, which includes temperatures from previous centuries. One way to estimate past temperatures is from CO2 measurements of trapped air in glacial ice, thousands of years old. Against these estimates, we’ll need to compare and judge current and continuing measurements.
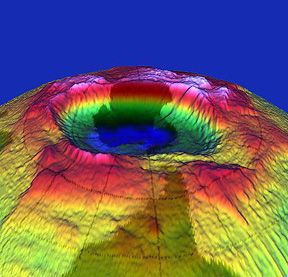
Another observable global change, caused by one of these trace gases, the CFCs, is the depletion of stratospheric ozone. Ozone in the stratosphere absorbs incoming solar ultraviolet radiation (UVR) that is dangerous to living systems. This UVR causes damage to the genetic material in living systems. Ozone prevents the UVR from reaching the Earth’s surface , and so protects us from its harmful effects. Spacecraft sensors have observed ozone depletion during the Antarctic winter, an observation that helped determine the chemistry underlying this process. Over the south pole, the right combination of cold stratospheric temperatures, ice crystals (or other solids with surfaces upon which the destruction chemistry occurs), and the global wind patterns intensify the process. Space sensors have observed similar (although smaller) depletions in the Arctic, and some of the chemical agents are increasing over mid-latitude regions, i.e., where most humans live.
These depletions have come to be known as "ozone holes". That this is an apt description is evident in this image of the Antarctic variations in ozone level that have been depicted in 3-D by "contouring" the different values:
The size and extent of the "hole" varies with time as is obvious in this series of October Antarctic ozone maps taken between the years 1979 and 1992.
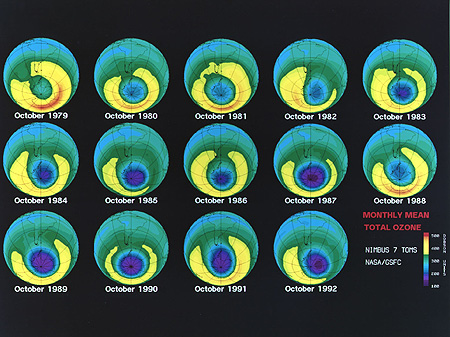
16-7: Comment on the patterns of ozone change you decipher from the above October sequence. ANSWER
Other human activities may increase the rate of global change. One activity now grabbing attention is deforestation, whereby humans slash and burn, or just clear-cut, huge tracts of trees to use the land for agriculture or the wood for building shelters. As developers denude these large regions, biodiversity decreases, and land-use, water run-off patterns, and local weather phenomena change. Satellite remote sensing has produced dramatic images of progressive deforestation, as witnessed in these two scenes taken five years apart over the State of Rondonia in the Brazilian Amazon Basin by NOAA's AVHRR.
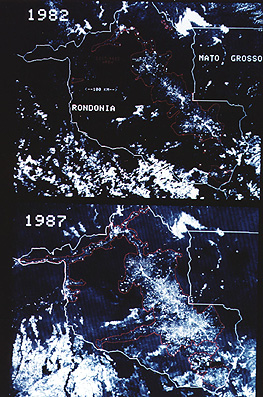
16-8: Estimate the percentage increase in deforestation in the middle of ANSWER
Thus, many observations and other data seem to point to humans as a major causative source, having at least the potential for modifying global phenomena. However, we are not always sure of this. We continue to wonder if some of the observed changes, such as an apparent increase in atmospheric temperature, are really due to human activities? Or are they part of a natural cycle that we are only now observing in detail, because of the presence of instruments and sensors that were hitherto not available? We also ask whether the current trends will continue and how detrimental they may be.

Primary Author: Nicholas M. Short, Sr. email: nmshort@epix.net
Collaborators: Code 935 NASA GSFC, GST, USAF Academy
Contributor Information
Last Updated: September '99
Webmaster: Bill Dickinson Jr.
Site Curator: Nannette Fekete
Please direct any comments to rstweb@gst.com.