
Data Handling: EOSDIS
Availability of data is critical to the success of NASA's ESE. The EOS Data and Information System (EOSDIS) (eosdis link) must be responsive to this requirement. EOSDIS manages data from NASA's past and current Earth science research satellites and field measurement programs. During the coming EOS era, EOSDIS will allow command and control of satellites and instruments, and will generate data products based on orbital observations. In addition, EOSDIS will generate data sets made by assimilation of satellite and in situ observations into global climate models.
EOSDIS's services will include:
NASA planners base the present plans for EOSDIS on an open system, with distributed architecture. This permits data controllers to allocate EOSDIS elements to various locations to take best advantage of different institutional capabilities and science expertise..
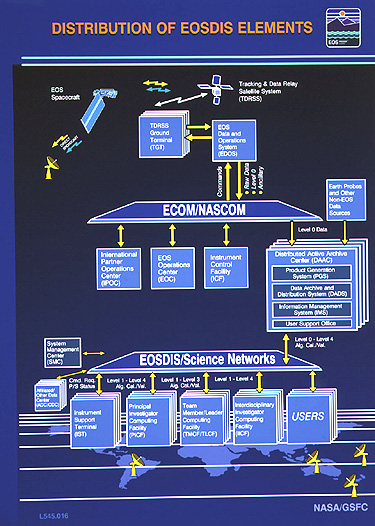
EOSDIS consists of several components including:
Together, these components will address all command and control; data acquisition, transport, reduction, storage, and visualization; and user access needs.
16-20: As was noted in the answer to question 16-15, the daily load on EOSDIS will be the largest yet faced by any NASA or other space agency mission - on the order of 3 terabytes, Can you think of some way to ease or lighten that load? ANSWER
Summary
As we noted earlier, the basic impetus for the kinds of studies we described is to provide input to planners and policy makers. Having access to raw (or even processed) data is of little use to such groups. What they need is information for making decisions about allocating and, perhaps, regulating resources. This information answers questions, such as, "If we do not curb automobile pollution, what may be its effect on atmospheric composition and temperatures over the next 5-10 years?" Or, "If we continue to deforest the Pacific northwest, what may be the effect on biodiversity, land cover, land use, and water run-off patterns?"
No one can actually predict the future accurately, but we can create mathematical models that generate useful predictive functions. Such models can be as simple as that shown in the first figure, which describes the distribution of incoming solar energy through major portions of the Earth's systems. It's similar to balancing the books: The sum of all components that use solar energy must equal the amount of incoming solar radiation. If they don't add up, our model is wrong, or we're missing something.
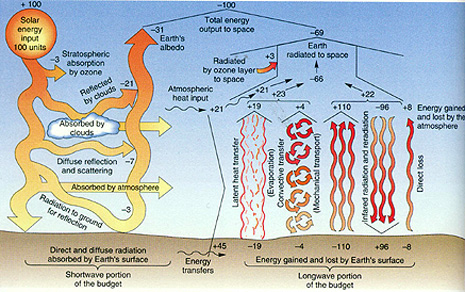
Christopherson, R.W., GEOSYSTEMS: An Introduction to Physical Geography, 2nd Ed. © 1994. Reproduced by permission of Prentice Hall, Upper Saddle River, New Jersey)
16-21: This diagram, while not constructed to explain or support the EOS program, does suggest that the various sensors in the EOS missions are all measuring aspects of the same phenomenon. What might that be? ANSWER
But the models we need for an Earth-system, predictive capability are much more complex than what we show here. Such models must account for energy budgets, sources and sinks of carbon and other biogeochemically related materials, effects of temperature on wind speed and direction, precipitation patterns, land use patterns, speed and direction of oceanic currents, increases in so-called greenhouse gases, and more. A full understanding of how these components interact with each other supports our willingness to trust the output from such models. We show an example of the complexity of these models, along with a color-coded indication of how EOS and other MTPE platforms contribute to a better understanding, in the figure below, which we based on the Bretherton diagram:
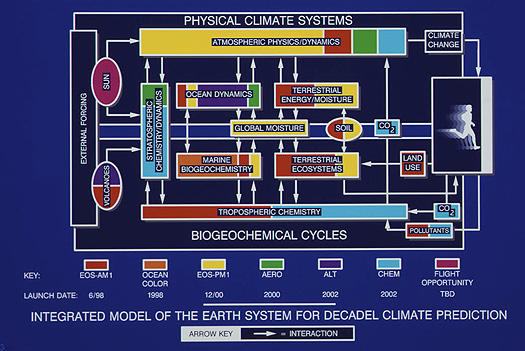
Because of the complexity of such models, we must accumulate multitudes of timely data from many different sources, over a relatively long period, by a highly advanced data and information system that ingests, processes, and distributes those data to interested parties around the world.
Based on the predictive models described above, we must make decisions based on our understanding of the potential magnitude of global change, in order for planners and policy-makers to define strategies for mitigation or adaptation. These strategies may have widely different economic and societal impact, involving health, standard of living, and quality of life. EOS studies address how climate changes affect water resources, agriculture and ecosystems, and provide fundamental data sets on land-cover change, and measures of sea level change. These EOS measurements and the resulting predictive models address such topics as marine productivity, ozone depletion, air quality, and resources monitoring. These activities give us the tools we need to understand our Earth system and its many subsystems, and to understand the role we play in modifying such systems, and the roles they play in our daily lives.
As you may guess, NASA has a current, extensive homepage dedicated to EOS Project Science (http://eospso.gsfc.nasa.gov/). They have in-depth coverage and reviews of topics, such as, Earth System Science, EOS Investigations, Mission Profiles, Airborne Simulator imagery, Data Products, Educational Material, Publications and Sources, and connectable EOS-related servers. We drew some of the images and textual information in this section from these sources. We invite you to browse the EOS homepage to expand your awareness of the status and future plans of the GCRP, MTPE, and EOS, which together constitute one of the most ambitious and involved research programs in the history of mankind.
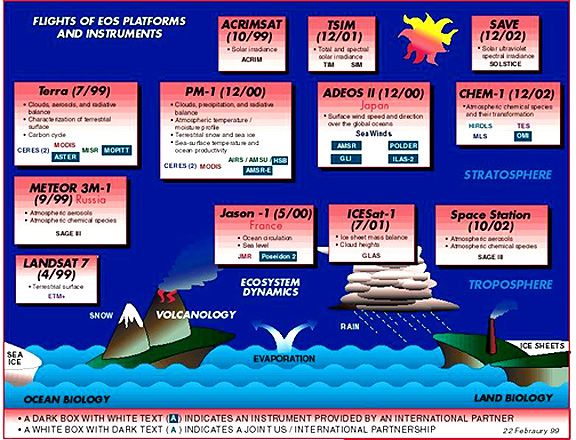
We remind you that ESE is actually only a part of the multi-national (international) efforts to fly a series of satellites and other missions dedicated to a broad variety of Earth observations. This next diagram is a near-current summary of this vast program.
Before closing, we bring to your attention another related program that will rely on a variety of satellites and sensors, and the participation of many nations, to monitor and assess aspects of the environmental that relate to natural and manmade disasters. This program is an outgrowth of agreements worked out during a May 1996 Workshop on International Cooperation in Space. We summarize the results of their recommendation to use remote sensing for this purpose in the table shown here. We've since added other satellites to the list, and EOS will contribute to the monitoring capabilities. (See also, the summary of satellite programs planned over the next ten years given in Section 20 [page 20-1]).
System
Status
Observation capabilities
Sample disaster mitigation applications
Weather satellites
existing
global day and night observations
prediction/monitoring of hurricanes, typhoons, tornadoes, volcanic eruptions
Landsat
existing
visual 30 m and multispectral 80 meter land observations
land use, flood extent, environmental monitoring
SPOT
existing
visual 10 to 30 m land observations
3 dimensional mapping, flood extent, damage assessment, crop identification
IRS-1C
existing
visual 6-30 m land and sea observations
3 dimensional mapping, oil spill detection, flood extent, damage assessment
RESURS-O1
existing
visual and multispectral 160-600 meter land and sea observations
regional environmental mapping, monitoring of coastal zones, crop development, drought, flood areas and fires
ERS
existing
all weather 25-500 m land and sea observations
3 dimensional mapping, oil spill detection, flood extent, damage assessment, night coverage
Radarsat
existing
all weather 10-100 m land and sea radar observations
3 dimensional mapping, oil spill detection, flood extent, damage assessment, night coverage
JERS
existing
all weather 18 m land and sea observations
3 dimensional mapping, oil spill detection, flood extent, damage assessment, night coverage
SeaWiFS
probably launched in 1997
multispectral 1 & 4 km sea observations
oil spill detection, ocean pollution monitoring, algae detection
Cosmos, KVR-1000
existing
visual 2 m land observations (not near-real-time)
high-resolution mapping, infrastructure identification, terrain analysis
EarlyBird
launch scheduled December 1997
visual 3 m land observations
high-resolution mapping, infrastructure identification, terrain analysis
CTA Clark
launch scheduled for late 1996
visual 3 m land observations
high-resolution mapping, infrastructure identification, terrain analysis
QuickBird
launch scheduled for 1998
visual 1 m land observations
high-resolution mapping, infrastructure identification, terrain analysis
Space Imaging 1 (Carterra-1)
launch scheduled for March 1998
visual 1 m and multispectral 4 m land observations
high-resolution mapping, infrastructure identification, terrain analysis
OrbView-3
launch scheduled for Mid 1998
visual 1 & 2 m and multispectral 4 m land observations
high-resolution mapping, infrastructure identification, terrain analysis, crop identification
Space Imaging 2 (Carterra-2)
launch scheduled for 1998
visual 1 m and multispectral 4 m land observations
high-resolution mapping, infrastructure identification, terrain analysis, crop identification
OrbView-3B
launch scheduled for 1999
visual 1 m and multispectral 4 m land observations
high-resolution mapping, infrastructure identification, terrain analysis, crop identification
SPOT 5A
launch scheduled for 2002
visual 5 m land observations
high-resolution mapping, infrastructure identification, terrain analysis, crop identification
Examples of images from several of the above systems are presented on page 3 of Section 20.

Primary Author: Nicholas M. Short, Sr. email: nmshort@epix.net
Collaborators: Code 935 NASA GSFC, GST, USAF Academy
Contributor Information
Last Updated: September '99
Webmaster: Bill Dickinson Jr.
Site Curator: Nannette Fekete
Please direct any comments to rstweb@gst.com.