
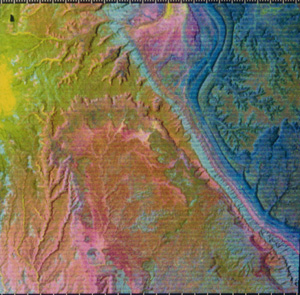
Geologic Map of the Waterpocket Fold
We can understand these rock-unit relationships by examining two geologic maps. The first was extracted from the Utah state geologic map. The blue units are Upper Paleozoic limestones and shales and Triassic sandy shales. Jurassic to Cretaceous sedimentary rocks make up the thin band outcrop patterns within the Waterpocket Fold. To the east are Cretaceous shales (green stripe pattern) and a capping sandstone, the Mesaverde (in yellow).
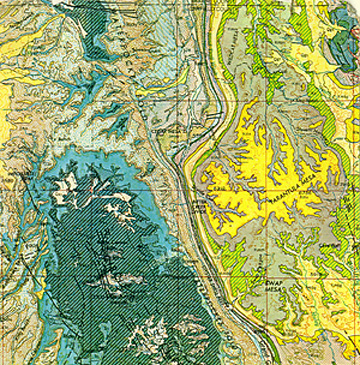
The Circle Cliffs are marked at A, the Waterpocket Fold at B, and the Tarantula Mesa at C. The individual units, or formations, are indicated, with their symbols, in the legend, in which the youngest strata are placed in the upper left (first column) and the oldest in lower right (second column). Refer to this second map when we display the scene images. You may want to print it if your browser supports this.
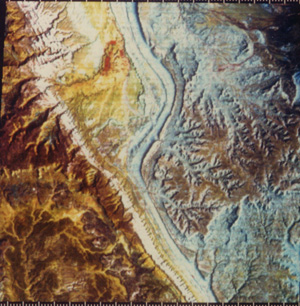
The Waterpocket Fold was one of 11 Utah sites imaged by a 24-channel (band) scanner flown in June 1976 on NASA Aircraft Mission 340. The purpose then was to simulate the TM sensors to determine if the data were good enough for rock-type identification. An aerial camera with color film obtained high resolution photographs at a scale of 1:24000 (one inch on the picture = 24,000 inches on the ground), one of which we reproduce here
to detail the area that we examine in a Landsat scene. You can compare locations by switching back and forth between this photograph and the geologic map. You can also compare this photograph with the color PCA image made from some of the 24 channels (bands) on the Bendix airborne scanner.
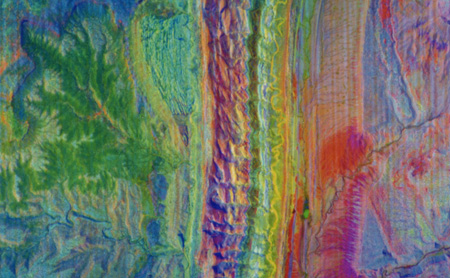
The resolution in this image is 17ft. Data from seven channels in the visible and near-IR were combined to generate a series of images based on six Principal Components. This color composite was made from the first three components. Using this composite as an indicator of the rock unit classes, an interpreted geologic map (not shown here) was drawn, in which the symbols for each formation are the same as the field-based geologic map, which we already examined. A strikingly strong correspondence between the two maps (the published geologic and the scanner data maps), is evident which providing confirms that high resolution, narrow band multispectral imagery can be a powerful tool for mapping.
How well can space imagery capture this scene? The next image is a false color composite (band 4 = blue; band 5 = green; and band 7 = red), made from data acquired by the MSS onboard Landsat 1 on August 6, 1972 (scene 1014-17370). This image was produced using JPL's VICAR imaging software program. Except for the patch of red vegetation near the top, the colors of the rocks are roughly similar to their natural colors. The Triassic units (Moenkopi; Chinle) and the Jurassic Wingate Formation are orange-brown here. The Navajo is white and the Entrada and younger units to the east are yellow-brown. The Masuk and Blue Gate shales with interbedded sandstones are bluish, while the Mesaverde is brownish.
The same August 1972 data set was processed by JPL's VICAR software using the Karhuen-Loeve transformation program to calculate four principal components. In the PCA composite image below, PC1 was assigned to blue, PC2 to green, and PC3 to red. The units east of the Fold show mainly in blue colors but so does the Navajo Formation. The Triassic rocks appear largely in shades of red. The Kayenta is expressed in green. The yellow patch at the left is of uncertain identity but probably coincides with thick stands of cedars and some pines.
Next, we show a TM band 2 image acquired by Landsat 4 in the summer of 1984.
Consider the following observations and refer to the geologic map as necessary: The terrain east (right) of the Fold, occupied by units from the Blue Gate Shale to the Mesaverde Sandstone, generally has brighter tones in keeping with the facts that the two sandstone Formations are lighter and more reflective and the shales have weathered, bright surfaces that mask their darker, fresh colors.
Look at the labeled (and degraded) version of this band to examine the tonal responses for various other units. You may want to print this map for easier reference.
The Navajo Sandstone (a) is the brightest single unit in the scene, followed by the valley floor to the east, much of which is covered by alluvium (b). The Entrada (c) and Wingate (d) Sandstones are notably darker, as is the top surfaces of the Mesaverde (e). Note that the Wingate "pinches" out along the Fold towards the bottom of the image, which suggests that its dip steepens making its outcrop pattern thinner. The Kayenta Formation (f) is barely discernible in the image as a thin, darker tone, but the Chinle (g), also darker, has a wider outcrop pattern, because it is thicker and less steeply dipping. The Emery Sandstone (h) has a darker tone than the overlying Masuk Shale (i) because, in the field, it is dark brown (similar to the Dakota Sandstone seen in the foreground of this picture)
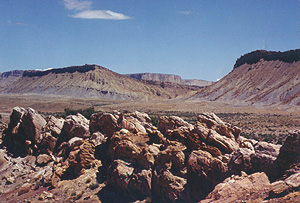
and also supports clumps of sage and other vegetation. Units in the sequence from the Salt Wash to the Ferron Sandstone (around j) are not visually separable, a consequence of their similar colors and relative thinness. The oldest formation, the Moenkopi , appears as a single flat-lying unit on the geologic map, but in the scene we can visually subdivide its outcrop areas (mainly in lower terrain) into two subunits. In fact, in the field the Lower Moenkopi (k) is a darker reddish than the more brownish, lighter Upper Moenkopi (l) but these two stratigraphic members are not thus distinguished on the map. Other darker areas around (m) lie within flat-floored valleys and are presumably alluvial fill. Very light thin bands as at (n) correspond to the Shinarump Formation on the map. These in the field make up steep faces along the Circle Cliffs that reflect much more light. But, patches at (o) are extraction pits into the Shinarump, which has been mined for its uranium content. The very dark blotch at (p) is a cattle watering hole made by damming the intermittent stream.

Collaborators: Code 935 NASA GSFC, GST, USAF Academy
Contributor Information
Last Updated: September '99
Webmaster: Bill Dickinson Jr.
Site Curator: Nannette Fekete
Please direct any comments to rstweb@gst.com.