
Lets switch attention now to the world's forests, natural and planted and maintained for future harvesting. The distribution and condition of these forests, along with other principal types of vegetation in the global biosphere, can be determined and refined periodically, by analyzing Vegetation Index data acquired by satellites. As an example, here is a plot of the distribution of general forest classes, as they were identified in AVHRR data from NOAA 7 and 9 metsats. Colors that are not identified in the legend include red = shallow, coastal or inland waters; blue = ocean waters; purple = deep ocean; black in the arctic and antarctic regions = not classified.
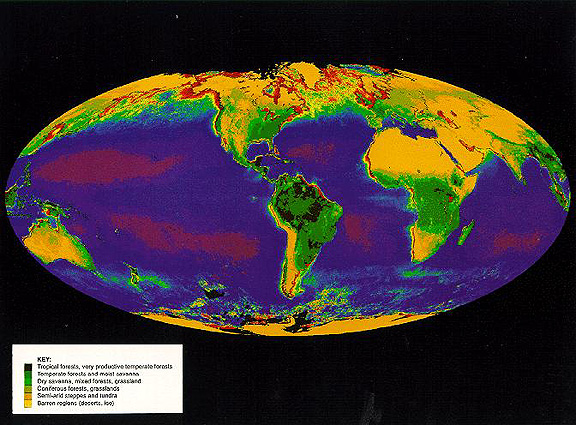
3-12: Which continent appears to be most widely vegetated; least widely? ANSWER
One obvious application lies in determining the geographic and areal distribution of major types of sylvan vegetation and their ecological settings. Generally, Landsat and other remote sensing systems can readily distinguish between deciduous and coniferous forests, and can recognize shrublands, savannahs, and various desert ecosystems. But, identifying most tree types at the species level is much more difficult, unless high resolution images are available and the trees have distinctive crowns and leaf shapes that produce fairly explicit spectral signatures. Easier tasks, that have widespread applications, involve discerning defoliation - either in the extreme with tree removal by clearcutting or through denuding trees of their leaves by insects, and assessing forest fire or storm damage.
The Amazon Rain Forest; Deforestation
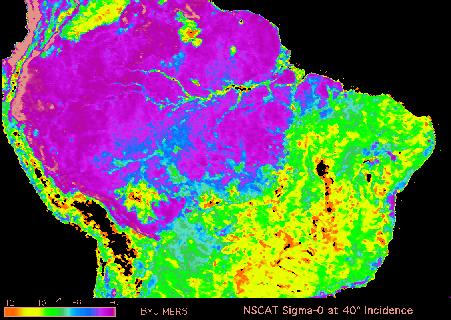
Clearcutting in parts of the world has become a major problem and is the subject of much environmental concern, because of habitat destruction and biochemical threats to the atmosphere. Clearcutting disturbs the balance between the oxygen and carbon dioxide produced and used in photosynthesis. The systematic attack on rain forests in the tropics, to provide open land for farming and other development, is currently the greatest source of alarm. The top concern if for the vast jungles of the Brazilian Amazon, which transition into savannahs at their edges. Over the years, farmers, ranchers, and other entrepreneurs have cleared about 200,000 square miles (about 10%) of the 1.93 million square miles in the Amazon Basin. Fortunately because of an outcry from the rest of the world, the rate of removal is slowing somewhat. Radar data from the NASA Scatterometer (NSCAT) (see Section 14) operating over South America shows (below) the distribution of several general, land-cover classes in the Amazon. In this image-based map, rain forest appears in blue/purple, woodlands and savannah in green or yellow, and farmlands or undeveloped mountain lands in black.
This next Landsat TM image is a natural color composite that dramatically illustrates the uniformly dense tropical forests. These forests are the largest continuous tract of thick woodlands anywhere on Earth - and provide a haven for diverse plant and animal species, which are now threatened with destruction.
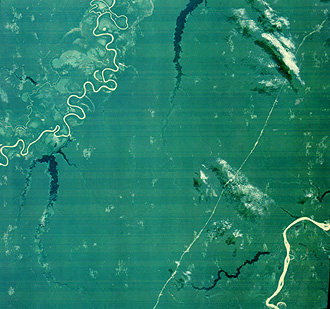
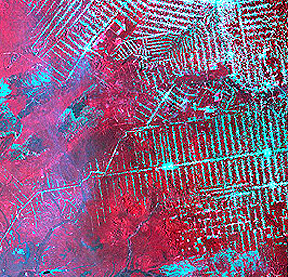
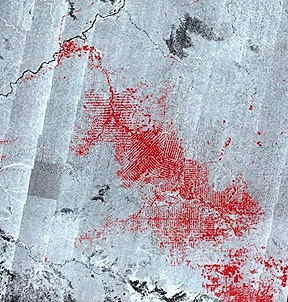
One of the most active programs for converting rain forests to cultivated land persists within the State of Rondonia in the southwestern Amazon. In fact, this area is justly cited as the prime example of land stripping. The next three images support this conclusion. The first (left) image is a Landsat TM subscene taken in 1986. The neat rows or strips in blue are cleared land amidst the surviving forest. In the right image is a Synthetic Aperture Radar (SAR) image taken by the Japanese JERS-1, in which areas of clearcutting show in red.
 |
 |
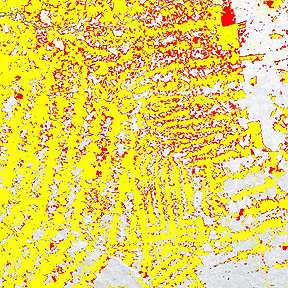
Radar imagery, which can penetrate cloud cover (see Section 8), is especially effective for short-term monitoring of changes in deforestation. This next image (courtesy of NASDA) uses two JERS-1 SAR images taken 15 months apart to pinpoint the enlarged edges of cleared strips. Preserved rain forest is shown in white. Deforestation as of July 1992 appears in yellow, and additional stripping up to October 1993 is marked in red. While the changes are not gross, the encroachment on remaining natural forests is obvious
3-13: Make a guess as to the percentage of South American rainforest that has been cleared or defoliated. ANSWER
At a smaller scale, but nevertheless subject to continuing debate, is the stripping of whole tracts of woodlands in temperate and boreal forests to provide lumber and paper pulp. Loss of the redwoods in the western U.S. coastal forests is a typical situation. While current laws require reforestation of most of these lands, the rate of regrowth in some regions is not keeping pace with removal. Some of these forestry applications are nicely portrayed with several Landsat subscenes (below) of heavily timbered areas of Canada, as prepared by the Canadian Centre for Remote Sensing (CCRS) http://www.ccrs.nrcan.gc.ca/ccrs/. The first two cover an area near Port Renfro on Vancouver Island in British Columbia, in part of the Pacific Coastal Ranges with fir, spruce, and some deciduous trees. In this next subscene are a pair of TM images, each 7 x 15 km (4.3 x 9.3 mi), taken on July 17, 1984 (left) and June 19, 1991.
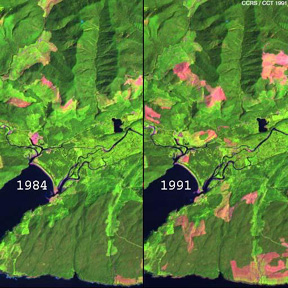
Each is processed with TM band 3 = blue, band 4 = green, and band 5 = red. This color scheme makes active vegetation green. Clearcutting of the mixed forest in the year or so before 1991 is in pinkish-red. Mature vegetation is darker green and regenerated forest appears in light green.
3-14: Estimate the increase in clearcutting from 1984 to 1991. ANSWERS
Another way to carry out this change detection is to use two bands from one year and one band from the other year in making the color composite. Note this combination in the following image:
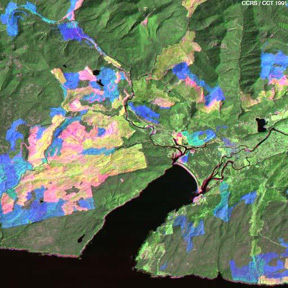
In this 15 x 15 km (9.3 x 9.3 mi) version, TM bands 4 and 5 from 1984 are assigned to green and red, and band 5 from 1991 is shown in blue. Once again, mature forest is rendered in dark green and reforested land in light green but here pink denotes areas that were recently deforested in 1984 and blue refers to areas that were clearcut between 1984 and 1991 but have yet to make a strong recovery.
We shift now to part of the boreal forestlands that are widespread on the Canadian Shield. The area (15 x 15 km, 9.3 x 9.3 mi) is in an isolated timber wilderness near Lac Nemiscau in northern Quebec:
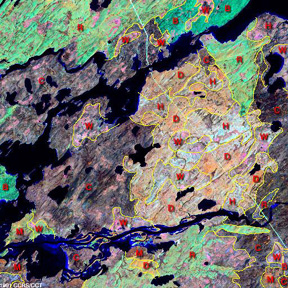
In this August 20, 1991 subscene, TM bands 5, 4, and 3 have been assigned to red, green, and blue, respectively. The Riviere de Rupert and associated water offshoots appear in black. Shades of bright green are areas of recent, partially recovered fire burns (B in red lettering) or regenerated forest (at R). Purple-gray denotes coniferous forests (at C) and orange is deciduous forest (at D). Small areas of wetlands and bogs (at W) show as pink; M refers to mixed forest, and H indicates heath (evergreen shrubs, similar to Scottish heather) with trees. Try to pick out the power line running to the north. This false color rendition is almost as graphic and definitive as a supervised classification,because of the incorporation of the longer wavelength, TM band 5.

Collaborators: Code 935 NASA GSFC, GST, USAF Academy
Contributor Information
Last Updated: September '99
Webmaster: Bill Dickinson Jr.
Site Curator: Nannette Fekete
Please direct any comments to rstweb@gst.com.