URBAN AND LAND USE APPLICATIONS:
FROM LOS ANGELES TO PARIS
As strongly hinted in the first three sections, space imagery (and aerial photography as well) is a powerful medium for mapping what's at the Earth's surface. We can identify and categorize the various natural and man-developed features in terms of land cover. The term land use is almost a synonym, but refers specifically to how the land is used for human activities. Land cover and use maps are an essential input to Geographic Information Systems, described in detail in Section 15. Most of these maps follow some classification system. One in common use is that developed by James Anderson and his colleagues at the U.S. Geological Survey. This hierarchical system has four levels. The two higher ones (Levels I and II) are categories that we can usually identify and hence, map, using space images, whereas, aerial photos (for higher resolution) are needed for Levels III and IV. This classification in Levels I and II is shown here:
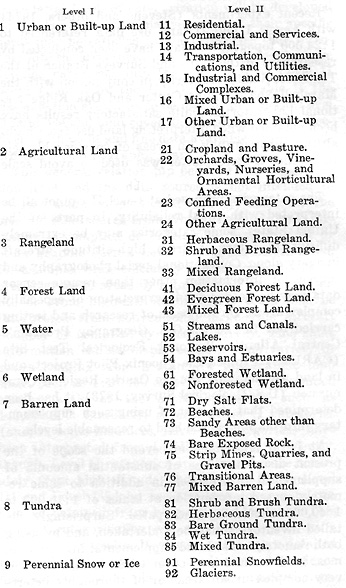
To illustrate the subdivisions at Level III, we pick Level I = Urban - and Level II = Residential, then the subdivisions under Level III are: units = Single-Family; Multi-Family; Mobile Homes; Hotels/Motels; and Other. Generally, the finer the breakdown, the more on-site, ground truth information we need. Maps for Levels I and II can be colorized, and we can add numerical symbols (e.g., 115 = Residential Hotels) for individual features on maps with a large enough scale to fit them.
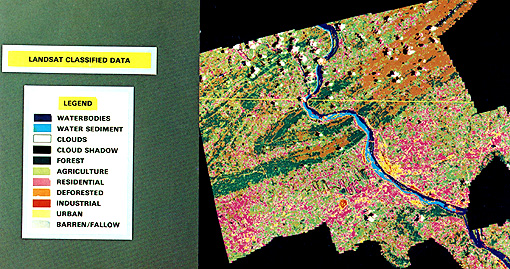
An example of a typical land cover and use map, which derived from Landsat imagery, is this multi-theme classification, covering an area surrounding Harrisburg, PA. The city is located next to the prominent yellow pattern assigned to urban. Smaller yellow blotches to the east and west are indications of downtowns, such as Carlisle, Hershey, and Lebanon. This metropolitan area, with a population exceeding 300,000, is generally spread out beyond the Harrisburg city limits. The legend category called "deforestation" describes the same Gypsy Moth defoliation reviewed in Section 3.
4-1: As a warm-up and refresher, briefly review how a metropolitan area appears in a standard false color composite. It is sometimes hard to delineate the outskirts of a suburban land use class; suggest one way to roughly decide on its boundary. ANSWER
Los Angeles, San Diego, and Tucson
Because much of the U.S. and world populations are concentrated in and near metropolitan centers, we concentrate in this Section on urban land uses. Major metropolitan areas are sprawling, often occupying a significant fraction of a full Landsat scene (although on a world scale,these areas comprise less than 10% of the land surface). This is certainly the case in one of the largest (areawise) urban regions in the world the Los Angeles megatropolis as seen in a resampled (lowered resolution) MSS image that covers most southern California.
Major geographic features in this image include the western Mohave Desert (containing Edwards Air Force Base), the southern tip of the Great (San Joaquin) Valley, the Tehachapi mountains on the north (extending from the southern tip of the Sierra Nevada), and the Transverse Ranges north of L.A. (bounded sharply on the north by the infamous San Andreas fault and on the south by the Santa Monica and San Gabriel Mountains). Los Angeles (lower right) lies within a structural basin, forming a lowlands that restricts air circulation and is a natural trap for pollutants (the famed L.A. smog).
4-2: Consult an atlas; find the above features and others that you may know about from living in, having visited, or having heard about Southern California. For example, find Hollywood. ANSWER
The urban signatures in a false color composite are clearly evident in the segment of the image containing a part of the numerous cities and suburbs that makes up the greater Los Angeles regional sphere of influence. The areas of higher population density show two dominant color themes: thin, usually blue to almost black, linear criss-crossing patterns representing streets and roadways; and areas in between that are also usually some shade of blue. The latter are the spectral expression of buildings, which tend to reflect brightest in the blue and green bands. Interspersed within these areas are patches of red, which correspond to city and town parks, cemeteries, golf courses, and pockets of intra-urban agricultural fields. Residential areas often have color signatures ranging from brown to pink to mild red, stemming from the mix of lawns and trees with houses and streets. In the Los Angeles hills and neighboring mountains, signs of homes and neighborhood centers are hard to recognize because the trees and brush swamp those areas with reds. The Palos Verdes Estates section on the ocean is a good example. However, bands and patches of blue in the valleys, such as in the Santa Clara valley east of Ventura, indicate commercial concentrations along highway strips.
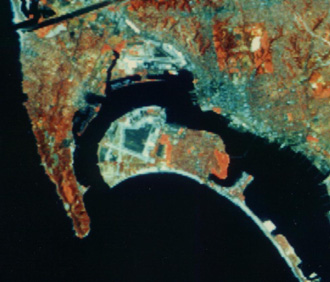
Urban areas are quite distinctive in radar imagery, as is clearly evidenced in this 1978 Seasat image (see Section 8 for a description of this satellite and a review of radar interpretive principles) that covers the west side of the Los Angeles metropolitan area. To aid in recognizing landmarks within the image, we include a segment of the 1989 Rand McNally atlas map that locates roadways, towns, and other features in the urban infrastructure.
 |
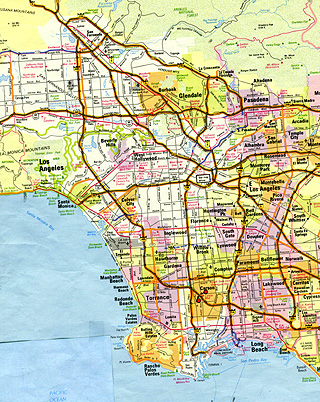 |
Many of the dark linear features in this radar image correspond to interstate highways and other major roadways. The two dark, narrow, east-west strips just on shore at Santa Monica Bay are runways at Los Angeles International Airport. These dark patterns come from specular (smooth) reflecting surfaces that deflect most of the radar beam away from the receiving platform. Generally, buildings return much of the radar signal, giving rise to an intermediate gray tonal signature (uniform here because most individual buildings are not resolved). Very light patterns are associated with high levels of backscatter caused, in some instances, by stands of vegetation. The light pattern along the west coast of the Palos Verdes peninsula, a luxuriant residential area may come from dense vegetation. However, the very bright, squarish pattern at the east end of the Santa Monica Mountains that extends into the San Fernando Valley around Burbank-Glendale is rather mysterious. It approximately coincides on the map with Griffith Park, north of Hollywood, but its position relative to roadways that are discernible in the radar image, indicates an inexact fit (possibly an effect of non-rectification).
4-3:Again, use an atlas and turn to the pages that show the Greater Los Angeles region (as does Rand-McNally). Try to locate the various Interstates and Freeways. Find such places as the Santa Monica Mountains, Glendale, central Los Angeles, Torrance, Long Beach. You will probably note that the road patterns in the radar image don't fit too well with the map - some main roads are not clearly singled in the image. Care to guess why this is so? What are the bright patterns protruding into the ocean at Long Beach? ANSWER
Even the lower resolution subscenes created from MSS images are effective ways of manifesting the major features of urban areas, such as street patterns, large buildings, airports, recreational parks, and some industrial facilities. This effect is certainly evident in this March 30, 1975, MSS view of the central parts of San Diego in southernmost California. It shows the Bay harbors, military and civilian airports, the downtown, Balboa Park, Mission Bay, and Cabrillo Point.
But, the value of much higher resolution to discerning metropolitan features down to the individual building scale is convincingly revealed by this November 22, 1988, SPOT image of inner San Diego, in which the three multispectral HRV band images, at 20 m (66 ft) resolution, are combined and registered with the 10 m (33 ft) panchromatic image taken simultaneously. The details in this image are persuasive proof that civilian space imagery can match, at least, the smaller scale aerial photos in clarity and information content.

4-4: First, with the help of your atlas, locate the San Diego landmarks mentioned above. Then, look at the U.S. Naval Air Station at the broad North Island at the end of the sea spit that makes up the Coronado area west of San Diego Bay. Using both the MSS and SPOT renditions, note any changes you can detect on this Island. Look for another change to the north. ANSWER
We now look at another major western, urban area in a somewhat different setting. Much of the city of Tucson, Arizona, displayed here in a Landsat TM False Color Composite subscene extending about 58 km (36 mi) east-to-west, sits on nearly flat terrain, wedged in by several large alluvial fans from the southeast and north. The latter fan actually is becoming a major residential suburb, noted for fine homes amidst dissected canyons. The entire city area was built up from stream deposits coming off the surrounding mountains.
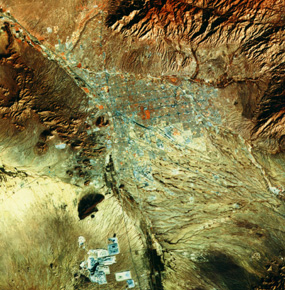
Many prominent, wide streets criss-cross the town, being laid out on the surveyor's section (one square mile) lines in the Township System. From the east, the Rio Rillito joins the Santa Cruz river (north-south) just north of the city's center. Tucson's International Airport sits to the south, about five miles from Davis-Monthan Air Force Base to its northeast. North of the city are the Santa Catalina Mountains, rising to 2800 m (9184 ft) at Mt. Lemmon, where citizens of this desert town in a basin around 825 m (2706 ft) e can ski in the winter. The tip of the Rincon Mountains touches the eastern edge of the city, and the scattered hills of the Tucson Mountains extend to the west. Copper mining is a major regional industry, as evidenced by the dark fan-shaped lake and the bluish-white open-extraction pits of the Pima Mission Mines to the south.
4-5: Much of the greater Tucson area has a brownish tone. Why? ANSWER

Collaborators: Code 935 NASA GSFC, GST, USAF Academy
Contributor Information
Last Updated: September '99
Webmaster: Bill Dickinson Jr.
Site Curator: Nannette Fekete
Please direct any comments to rstweb@gst.com.