
Unlike remote sensing reflected light from surfaces in which only the topmost layers (a few molecular layers thick) are involved, thermal remote sensing includes energy variations extending to varying shallow depths below the ground surface. The most critical consideration in analyzing and interpreting thermal data and imagery is that of knowing the physical and temporal conditions that heat the near surface layers. Over the seasons, minor shifts in the mean temperature in bedrock can occur to depths of 10 m (33 ft) or more. Solar radiation and heat transfer from the air significantly heat materials at and immediately below the surface during the day. Temperatures usually drop at night primarily by radiative cooling (maximum radiative cooling occurs under cloudless conditions), accompanied by some conduction and convection. During a single daily (diurnal) cycle, the near surface layers (commonly, unconsolidated soils) experience alternate heating and cooling to depths typically between 50 and 100 cm (20-40 in). The daily mean surface temperature is commonly near the mean air temperature. Observed temperature changes are induced mainly by changes during the diurnal heating cycle, but seasonal differences (averages and range) in temperature and local meteorological conditions also affect the cycle response from day to day.
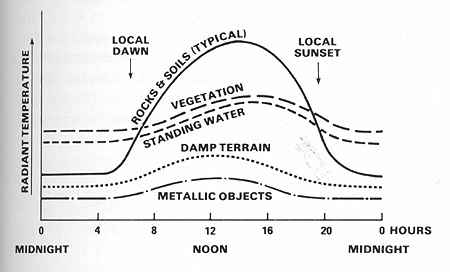
Changes in radiant temperatures of five surface-cover types during a 24-hour thermal cycle. From F.F. Sabins, Jr., Remote Sensing: Principles and Interpretation. 2nd Ed., © 1987. Reproduced by permission of W.H. Freeman & Co., New York City.
The curves shown here summarize the qualitative changes in radiant temperature during a 24-hr cycle, beginning and ending at local midnight, for five general classes of materials found at the surface. From these curves we can estimate the relative gray levels that a thermal sensor could record, as a function of the material and the time of day. Given two thermal images of the same locale, taken 12 hours apart, about noon and about midnight, we might determine the identities of co-registered pixels, based on their temperatures and thermal inertia's.
9-8 Letting the gray levels in a thermal image vary with temperature, predict the relative gray tones you would expect for a desert surface (rock and soil) and standing water at 4:00 AM and 2 PM. ANSWER
Differences in thermal inertia, reflectances, and emissivity of various materials and variable atmospheric radiance are important factors that modify the measured surface temperatures. Consider the four sets of curves plotted below:
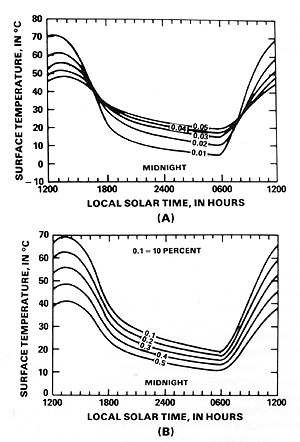
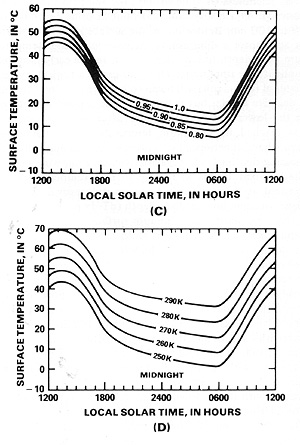
The top curves (A) show temperature variations resulting solely from differences in thermal inertia's of materials, with other factors held constant. Note the distinct crossover points. Values of P much higher than 0.05 (commonly, metallic objects) produce diurnal curves that approach a straight line passing through the crossover points. This effect is consistent with the earlier statement that materials with high thermal inertia's undergo smaller radiant temperature changes during a full heating/cooling cycle. Curves in B show the effects of different reflectances (in terms of albedo-the ratio of reflected solar radiation to incident radiation, in percent). The maximum and minimum daily temperatures and their differences (DT) increase with decreasing reflectance of solar insolation. In C, the curves represent changes associated with different emissivities; where most natural materials have values of e ranging from 0.80 to 0.98. Curves in D indicate the temperature effects introduced by the atmospheric radiances, which are caused by re-emission from water vapor, a common source of error. From these sets of curves, we learn that natural surface materials show considerable modifications in radiant temperatures because of these variables.
9-9: Why do the above curves reach their temperature minima around 0600 hours (6 AM). Make up a general statement or rule relating the change in surface temperature with changing values for each of the four property variables in these curves? ANSWER
The interplay among these varying properties combines to affect the rate of heating, total heat exchanged, and temperature profile (gradient = dT/dz, where z is thickness or depth) within the layers in the top 30 cm (1.2 ft) or so, beneath the Earth's surface. This profile can change considerably during the diurnal cycle. Different temperature vs depth profiles characterize different times of the day and night, as summarized in this diagram (for a low density soil with very low thermal inertia):
Regardless of the time of day, temperature profiles in the heating zone converge on a nearly steady value at some depth below 30-50 cm (depending on whether itÕs rock or soil, and its moisture content), but that depth slowly increases into the Earth as the geothermal gradient takes over. Before dawn (06:00), the surface zone (top 50 cm or so) shows a diminishing rate of increase in ground temperatures (dT/dz is positive overall). In the morning sunlight (08:00), the uppermost 10 to 20 cm (4-8 in) of a typical soil begin to heat rapidly, forming a negative dT/dz at shallow depth that reverts to a positive gradient in the lower near surface. By shortly after noon (12:00), the surface layers reach maximum temperature while the lower layers experience successively less warming with increasing depth. Following sunset into the night (20:00), as heat leaves, the gradient reverses (becomes negative) so that temperatures decrease at the surface but remain warmer down to the base of the diurnal change zone.
9-10: At what time of day does the soil show the least variation in temperature; the most? ANSWER
The maximum and minimum temperatures at the observed surface (topmost cm or so) depend mostly on the extent of buildup of the heat reservoir and its storage capacity through the affected layers. For materials that have the same density and albedo but different conductivity's and/or specific heats, the difference in predawn (lowest T values) and midday (highest T values) increases with increasing conductivity and decreasing specific heat. The actual magnitude of the difference decreases with depth, down to the stable (convergent) value at the base. The effect of increasing the material density (holding other variables constant in P = (r Kc)1/2) is to require more thermal energy to heat the additional mass in a given volume, so that less heat transfers to lower layers. With increasing density, the total added heat (derived from sun and air) distributes over a decreased thickness of surficial layers. So, in this instance, the maximum T reached at midday is lower, and the minimum at night is greater. Thus, the spread of daily temperature extremes (DT) tends to be lower relative to less dense materials. The corresponding rise in thermal inertia for denser materials simply expresses their increased resistance (sometimes referred to as thermal impedance) to temperature changes (smaller DTs) as heating or cooling progresses. For materials with higher thermal conductivity's, more heat transfers to greater depths, less remains concentrated at the surface, and, again, temperature extremes diminish, as evidenced by lower daytime surface temperatures and higher nighttime temperatures compared with materials having lower Ks (e.g., soils).

Collaborators: Code 935 NASA GSFC, GST, USAF Academy
Contributor Information
Last Updated: September '99
Webmaster: Bill Dickinson Jr.
Site Curator: Nannette Fekete
Please direct any comments to rstweb@gst.com.