 |
 |
|---|---|
| Plate E-16 | Map |
|
|
|---|---|
| Plate E-16 | Map |
According to Morris et al. (1972), the Dry Valleys of Antarctica have been ice-free for thousands of years and are excellent analogs for martian geomorphology. Mean annual temperatures average-20°C; the winter minimum temperature near Lake Viola was -51°C in 1960. Due to radiative imbalance, rock temperatures are known to exceed air temperatures. Morris et al. (1972) note that mean wind speeds are 10 to 15 km/hour. Ventifacts and pebble ridges commonly are positioned with their cut-and-polished surfaces facing west, the dominant wind direction.
The rocks are Upper Precambrian to Lower Paleozoic folded metasediments cut through with large sills and dikes. Morris et al. (1972) located a prominent field of transverse dunes perpendicular to the prevailing wind direction on the eastern end of lower Victoria Valley. They find beds of frozen snow and sand exposed beneath the mobile sand of the dunes. These are inconsistent with the present dune forms and suggest that they were deposited during austral winter months when winds blow from the west instead of the east.
| Figure E-16.1 | Figure E-16.2 |
|---|---|
 |
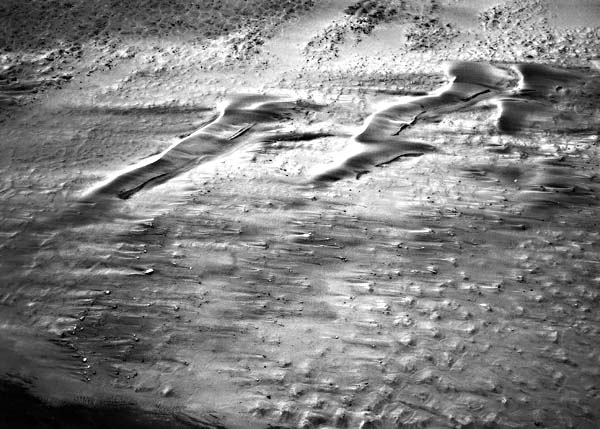 |
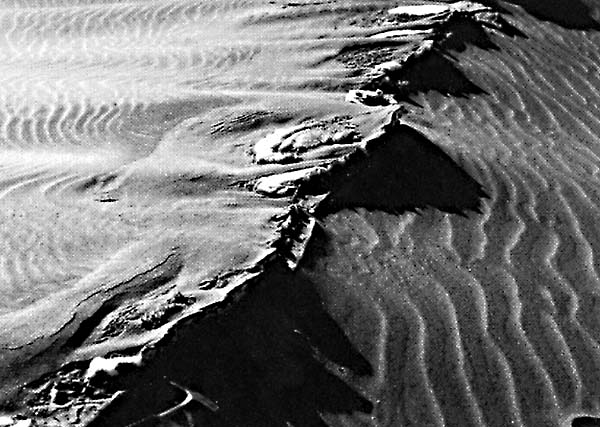
Figure E-16.1, from an area near the center of the Plate, depicts a linear dune in the lower Victoria Valley. At the top of the dune is a l-m thick cornice, which is an overhanging ledge of frozen sand and snow. As the dune dried out, the cornice disappeared.
Figure E-16.2 is an aerial photograph north of the Insul Range looking west up Victoria Valley. Crescentic dunes are moving right to left on patterned ground formed on glacial drift. The dunes are 5 to 10 m high, and the center dune is 250 to 300 m wide. Frozen sand beds crop out at the windward (right) side of the dunes.
| Figure E-16.3 | Figure E-16.4 |
|---|---|
 |
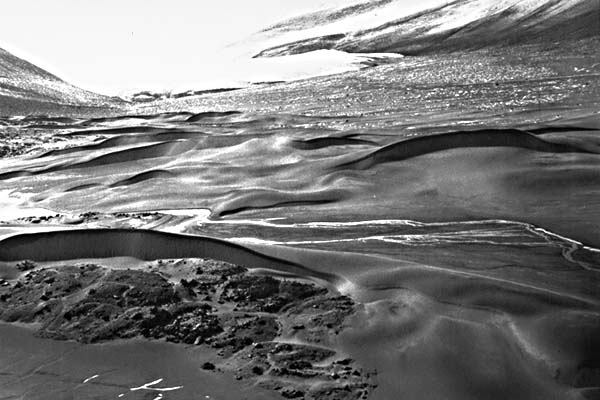 |
Figure E-16.3 offers a close-up view of eolian features in the Dry Valley region. The rock hammer in the lower left shows the scale. The ripples indicate that the wind direction is right to left. Sand shadows to the left of the outcrop disturb the ripple pattern.
Cornices are at the crest of each of the linear dunes in Figure E-16.4. The cornices disappear as the upper surface of the dunes dry out. Victoria Lower Glacier is in the background of this figure. The dune in the foreground is encroaching on glacial drift.
| Figure E-16.5 |
|---|
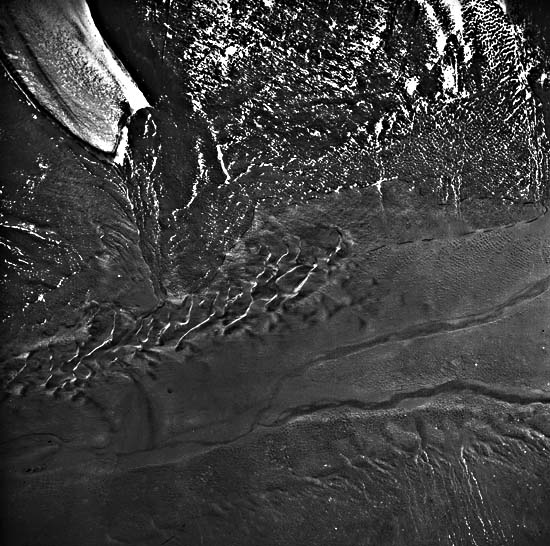 |
Figure E-16.5 is a small-scale vertical aerial photograph of transverse sand dunes. Packard Glacier enters in the upper left. The windward face of the dunes lies to the right. After comparing this 1962 photograph with a 1970 photograph, Morris et al. (1972) found that the individual dunes had not moved or noticeably changed shaped in the 8 years between the photographs.
Southworth (1984) produced a Landsat color composite of the Dry Valley region with contrast enhancement and band ratioing of bands 4, 6, and 7. He was able to discriminate several lithologic units and could differentiate between alluvium and glacial drift by comparing differences in surface roughness and composition. Landsat 2279-19361-7, October 28, 1975.
Continue to Plate E-17| Chapter 8 Table of Contents.| Return to Home Page| Complete Table of Contents