 |
 |
|---|---|
| Plate E-8 | Map |
|
|
|---|---|
| Plate E-8 | Map |
This Plate images on the northeastern part of the 220-km wide Lake Chad in the Sahel, a semiarid zone south of the Sahara. The Sahel was afflicted by a severe drought in the late 1960s and early 1970s and is currently recovering from another drought. Faure and Gac (1981) fix a mean time of 31 years between each of the last three droughts in the Sahel. From this, they correctly predicted that the recent drought would end in 1985.
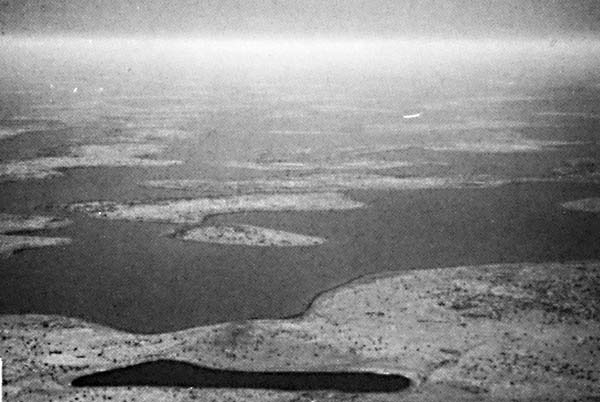
Lake Chad is slightly west of center of the Chad Basin, an extensive area of sand seas in Central Africa. Grove (1958) describes the present lake shore as having north-south-running ridges and hollows. Dunes form long closely spaced peninsulas and northwest- oriented lines of islands in the lake. The shoreline is illustrated in Figure E-8.1. The dunes are about 80 m high and, as can be seen on the Plate, are spaced 2 to 3 km apart. The interdune areas called bahrs, which become flooded during the rainy season, contain deposits and calcareous shales.
| Figure E-8.1 | Figure E-8.2 |
|---|---|
 |
 |
Lake Chad survives today in a savanna landscape distinguished from a humid and an arid environment by a highly seasonal rainfall (Thomas, 1971). As reported in Schneider et al. (1985), more than 90 percent of the annual rainfall occurs between June and September. The surface of the lake is highly responsive to climate change. Between 1964 and 1974, the surface of Lake Chad was diminished by a factor of 3 and its volume by a factor of 4 (Schneider et al., 1985). Due to evaporation and uneven water supplies, the surface area of the lake annually varies between 10 000 and 25 000 km2 (Van Chi-Bonnardel, 1973).
Goudie and Wilkinson (1977) suggest that Lake Chad stood between 380 and 400 m above sea level around 55 000 years ago. As drier conditions prevailed, dune fields were established until humid conditions returned. Nicholson (1980) notes that, from about 1600 until some time in the 18th century, the surface of the lake was about 4 m above the present level. Fluctuations of Lake Chad have been dated with pollen analysis and with human records, such as the Bornu Chronicals, which began before 1500. From these data, Nicholson concludes that, within the past several hundred years, the climate has changed significantly. She feels that the lake level changes are clear examples of the expansion and contraction of the desert belt. Studying lake sediments, Servant and Servant-Vildary (1980) state that the first appearance of windblown sands in the Chad Basin was 2 or 3 Ma ago.
| Figure E-8.3 |
|---|
 |
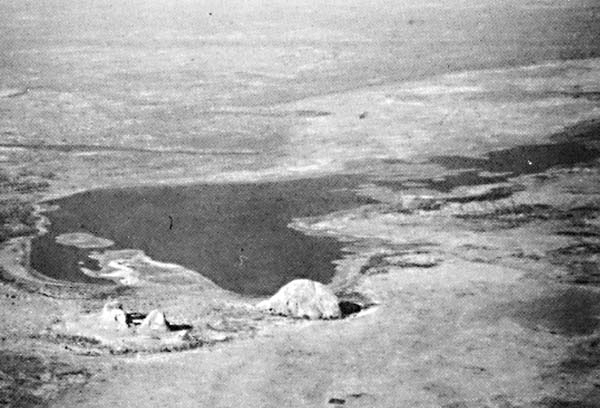
Extensive alluvial and lacustrine deposits near Lake Chad represent former shorelines at heights of 20 to 40 m above the present lake. An older lake, "Mega-Chad," appears to date from a pluvial period 10 000 to 7000 years ago (Thomas, 1971). Grove (1970) notes that the shoreline of Mega-Chad had cut into a group of volcanic plugs of columnar rhyolite southeast of the present lake. These hills are illustrated on an aerial photograph (Figure E-8.2). From the ground, the Mega-Chad shoreline traces on the plugs mark a level some 40 m above the present lake shore.
Schneider et al. (1985) illustrate the recent Sahelian drought by comparing a 1972 Landsat image with more recent images. They note that by 1978 the northern basin of Lake Chad had all but disappeared.
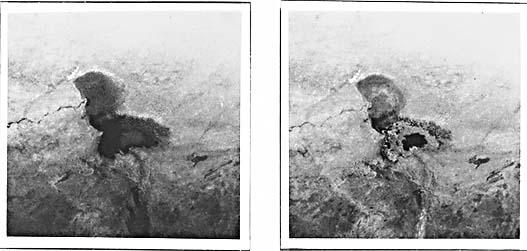
Figure E-8.3 is a visible (left) and near-IR (right) Advanced Very High Resolution Radiometer (AVHRR) image of the Lake Chad area. AVHRR data are available daily from NOAA-7, with a resolution of about 1 km. The images cover a 1500-km swath. In the visible image, the lake bed is dark gray, and the shallow sediment-rich water is light gray. On the infrared image, the water is black and is surrounded by vegetation.
Schneider et al. (1985) map changes in vegetation over the Lake Chad region using a normalized vegetation index calculated by comparing the spectral response of an area on the AVHRR bands. These authors use AVHRR thermal infrared bands to generate temperature maps, from which they find that the southern basin is about 14°C cooler than the adjacent desert and the northern basin is only about 4°C cooler. The water and vegetation in the south account for this lower temperature. With its coarse resolution and daily coverage, the AVHRR system provides data that supplement Landsat data. Landsat 50250-08534-4, November 6, 1984.
Continue to Plate E-9| Chapter 8 Table of Contents.| Return to Home Page| Complete Table of Contents