 |
 |
|---|---|
| Plate G-18 | Map |
|
|
|---|---|
| Plate G-18 | Map |
The District of Keewatin, in which this area is located, occupies that part of Canada´s east-central Arctic which lies north of the Manitoba border to the Arctic Islands, and from the northwest side of Hudson Bay to 149°W longitude. It is an area of continuous permafrost. The tundra environment supports only low arctic vegetation such as small shrubs, heath plants, grasses, mosses, and lichens.
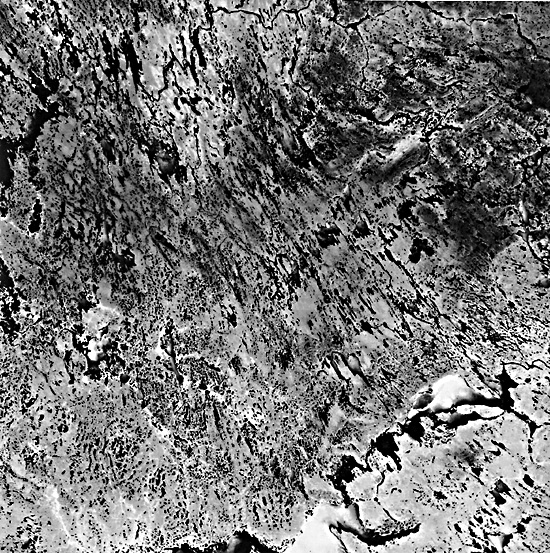
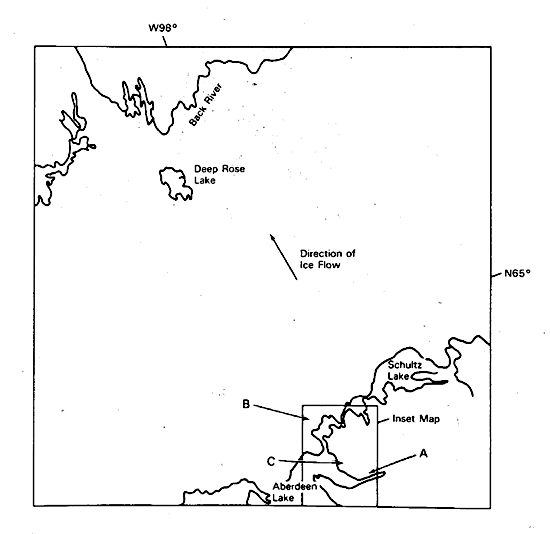
The entire area was glaciated during the Wisconsinan by continental glaciers that left varying amounts of drift cover. The direction of the ice flow can be deduced from features such as fluted till plains, drumlin fields, and striations, which indicate flow in two major directions. This has led to the Keewatin ice divide theory which states that an elongate center existed from Wager Bay through Baker Lake to just north of Ennadai Lake. Ice flowed to the northwest and southeast from the divide. Flow from the southern end of the divide was to the south. The divide is located to the east of the Landsat image.
| Map G-18.2 | Figure G-18.1 |
|---|---|
 |
 |
The initial retreat of the glacier was to the north-northeast from northwestern Manitoba. Glacier ice remained with its margin just north of Ennadai Lake, causing proglacial lakes to form because the northward-flowing streams were blocked. With the recession of the glacier toward the ice divide, water flowed into the depressed region presently west of the current shoreline of Hudson Bay.
The Landsat image for this Plate was acquired in mid-June 1973. Seasonal ice is still visible on many of the lakes, especially Aberdeen Lake, located at the bottom of the image. Wisconsinan ice direction is very apparent from the elongation of the lakes in a north-northwest/south-southeast direction.
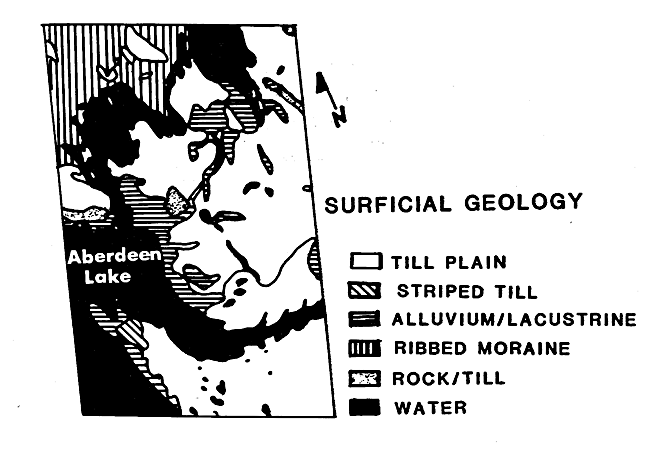
A supervised classification of the Landsat image (map below, on left) was conducted on a 30- by 40-km subscene centered just east of the east arm of Aberdeen Lake. This involved the selection of training areas of known conditions for classification, which was based on field data and previously mapped information. The corresponding spectral values for each training unit were then used to classify the entire image. Figure G-18.1 shows an example of the rock/till class (site A on the Plate image). The vegetation in this type of terrain is discontinuous, consisting of mosses and lichens. The rock has been shattered by frost, leaving typical felsenmeer. The sandy till is generally less than 1 m thick.
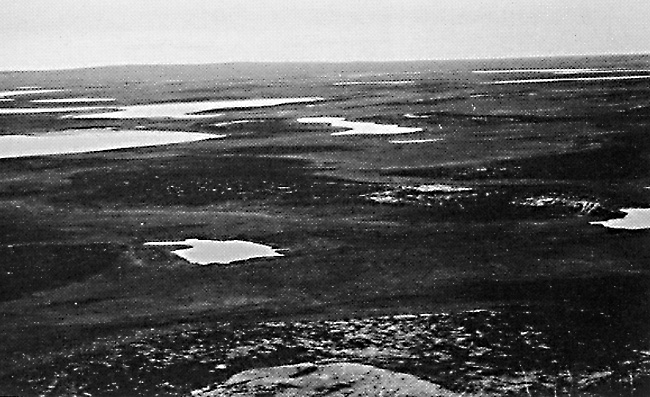
The ribbed moraine shown in Figure G-18.2 (site B on the Plate image) has continuous vegetation consisting of scattered tufts of grasses, lichens, and mosses. The surficial material is sandy with little or no silt and clay.
| Figure G-18.2 |
|---|
 |
The till plain in the region is also sandy with sparse silt and clay. The till contains no apparent material differences, but has a striped appearance when viewed from low-level aerial photography. Vegetation on the till plain consists of a discontinuous cover of lichens and grasses in depressions and mosses in wetter areas. The striped till has the same type of vegetation cover.
The alluvium/lacustrine deposits are well-sorted sand with no silt and clay components, although some silts and clays occur in recent alluvial deposits. The vegetation cover is discontinuous particularly on beach ridges and scarps. Backshores and terraces have continuous vegetation consisting mainly of grasses (site C on Plate image).
It is important to note that, when using the Landsat data for mapping surficial geology and geomorphology in this type of terrain, it is the vegetation communities on the different types of deposits which enable the different units to be mapped. These grow in response to slope form, material, moisture, and microclimatic influences that are strongly correlated with the surficial geology. (GCW: J. K. Hornsby) Landsat 1339-17351-7, June 27, 1973.
Continue to Plate G-19| Chapter 9 Table of Contents.| Return to Home Page| Complete Table of Contents|