
Mega-Geomorphology Defined and Geomorphic Maps
The primary thrust of the Tutorial to this point has dwelled on applications - the practical use of remote sensing to oversee conditions or solve problems dealing with the Earth's environments and manmade infrastructures. The emphasis has therefore been on the status of land and water surfaces, and on the overlying atmosphere, insofar as these affect human activities. The payoff from this monitoring is a better understanding of and interaction with (usually changing) events which influence our lives - food production, deforestation, urban expansion, mineral extraction, movement and severity of major storms, flooding, ocean nutrient detection, industrial site selection, to name a few - occurring at both regional and local scales that are readily observable from space.
We don't classify most of the categories, such as, those above, involving use of remote sensing, under a heading of "Basic Science" studies, although principles of science, such as the physics of electromagnetic radiation, are involved. Purists may argue that information about space "observables," such as determining ozone distribution worldwide, measuring heat flow in the oceans, and observing the biomes and their seasonal variation over the continents, augments the subject matter normally associated with basic science.
Perhaps the best examples of contributions of remote sensing to the fundamentals of science are those associated with exploring planets and astronomy. Similarly, some observations of a geological nature fall more into this "science" niche than into some applications discipline. In this section, we illustrate that idea by surveying how remote sensing has been a large factor in creating a new subfield in the science of geology: Global Mega-Geomorphology.
17-1: In the fields of chemistry, physics, botany, and geography, list at least one example of how remote sensing contributes to what might be considered a " more scientific" area of study. ANSWER
Geomorphology is the study of the shape or configuration of the Earth's (or, by extrapolation, any other planetary body's) solid surface, above and below ocean level, involving the classification of landforms and the processes by which they develop. The term "physiography" relates closely, referring to the description and evolution of land forms. By implication, water bodies, from oceans to small creeks, are participants in geomorphic processes, as major formative agents, even though their shapes tend to be transient and flat in detail.
Geomorphology is the study of the shape or configuration of the Earth's (or, by extrapolation, any other planetary body's) solid surface, above and below ocean level, involving the classification of landforms and the processes by which they develop. The term "physiography" relates closely, referring to the description and evolution of land forms. By implication, water bodies, from oceans to small creeks, are participants in geomorphic processes, as major formative agents, even though their shapes tend to be transient and flat in detail.
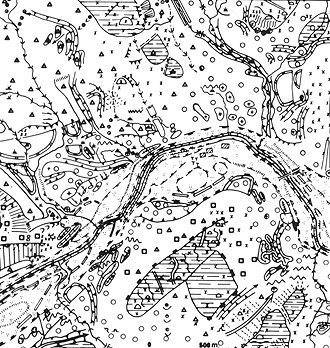
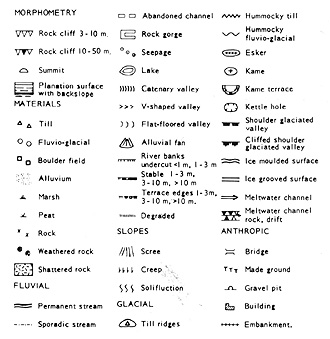
Until the space age, we conducted most geomorphic analysis by mapping– generally topographic (for shape) and geologic (for structure and underlying rock types)– and by field observations and measurements. The observation scales tended to be local or over relatively small areas. Eventually, aerial photographs became a prime tool for mapping and interpreting. We commonly depicted landforms as physiographic maps, using an artist's sketch technique to convey a three-dimensional oblique perspective (exemplified in the top image, below, for part of Utah), or, less often, as geomorphic unit maps (shown beneath for an area in Scotland).
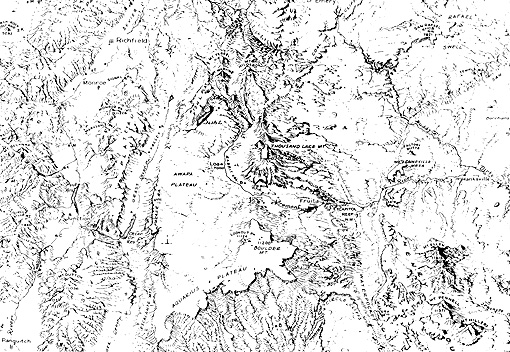
17-2: Find the Waterpocket Fold (Section 2) on the above sketch map. ANSWER
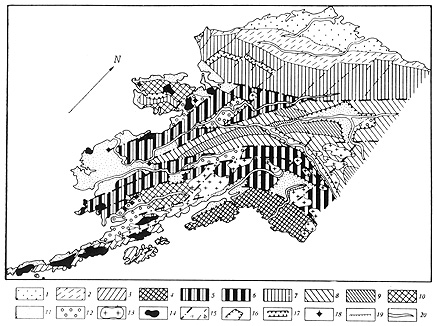
Geomorphic maps covering large areas–regional in scale–have not been commonplace. In the 1980s, a consortium of geomorphologists produced multi-colored maps of Europe and North Africa. We reproduce below an example of a regional map, showing much of Alaska, made by former-Soviet scientists. We deliberately left the units unidentified, because of their complexity.
However, in general, scientists did not produce studies and analyses of landforms at large scales, even after Landsat and SPOT products became widely available. Within a few years after launch, these satellite imagers had achieved nearly cloud-free global coverage (about 11,000 individual Landsat frames) of the Earth's land surface (exceptions: the polar regions and some oceanic islands). The ability to combine Landsat or SPOT images into mosaics, such as the one of southern Asia, shown in Section 7, greatly aided the pictorial expression of regional landforms. In effect, we can represent anywhere in the world in picture rather than sketch format, so that we see exact landforms (generally the most obvious features at small scales) of a truly global extent.

Primary Author: Nicholas M. Short, Sr. email: nmshort@epix.net
Collaborators: Code 935 NASA GSFC, GST, USAF Academy
Contributor Information
Last Updated: September '99
Webmaster: Bill Dickinson Jr.
Site Curator: Nannette Fekete
Please direct any comments to rstweb@gst.com.