
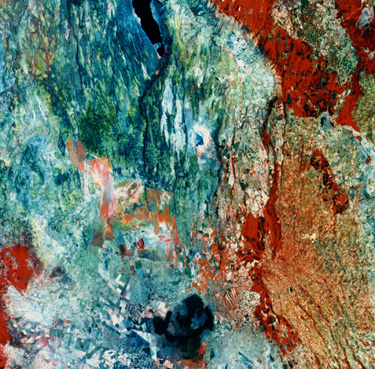
To test the merits of space imagery for finding fractures on Earth's continents, we examined a region, in which these are clearly visible and reliably mapped, as a ground-truth site using Landsat and SPOT scenes. The East African Rift is a zone of crustal extension, in which part of the eastern African continent is pulling away from its parent along one arm, separating the divergent blocks that stem from the triple junction, centered in Ethiopia (the second arm includes the Red Sea and the third, the Gulf of Aden off the Arabian Peninsula). Much of the rift consists of downdropped crustal sections, bounded by deep-rooted normal faults (forming grabens) that cut into the basaltic lavas, extruded in the resulting depressions. (In the fault type called "normal", imagine a rectangular block broken by a fault that inclines downward at some angle; the upper part of the block then slides down the fault plane; if there are two normal faults facing each other but the second inclined in the opposite direction (so the two converge), then the part of block between the two faults drops as a unit [the graben] becoming lower and leaving the blocks on either side of the fault pair higher; see illustration near top of page 3-2) These faulted lava fills, because they are recent and not severely eroded, have strongly-expressed surface scarps. They don't show tonal differences on the two sides of a fault, because the faulting affects the same rock type as seen at the surface. The scene below shows part of the rift in Kenya (Lake Hannington is at the top) as imaged by SPOT (described in the next section).
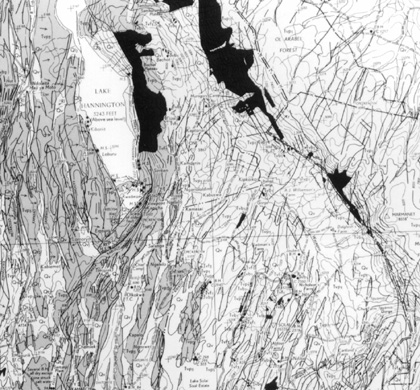
A map of rock units and fractures (most are faults) of the upper half of this image was made by Kenyan geologists by field mapping and aerial photointerpretating. We reproduce it here (at a quality that precludes reading details) to illustrate the reference database.
The next figure shows rose diagrams prepared by the author from his interpretation of Landsat Multi-spectral Scanner and Thematic Mapper images and a stereo pair from SPOT (see Section 11).
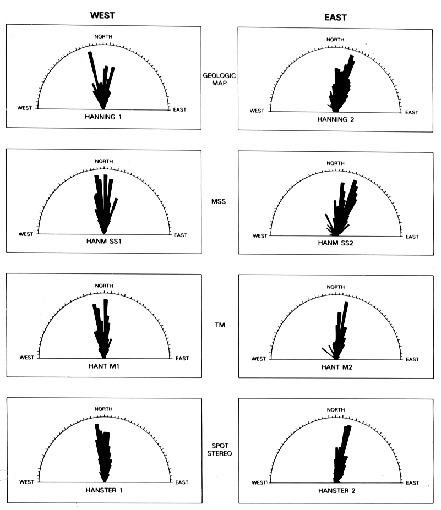
Areas west and east of Lake Hannington were treated separately. Hence, there are two sets of diagrams. Judging from the similarity of the orientations in the ground-map diagrams, Landsat and SPOT do an excellent job defining larger fractures. These topographic expressions are so pronounced that shadow bias is minimized, thus allowing accurate measurements of their trends.
2-18: Although the different satellite images show pretty much the same orientations, there is one difference when these are compared to the geologic map. What is it and why? ANSWER
Lineament analysis using space images has been particularly valuable in determining regional and subcontinental fracture patterns that reveal some of the stress history imposed on large crustal units. Surface exposures of deep crustal rocks are known as shields which are mostly igneous and metamorphic, and form the basement core of the continental craton. Shields typically contain major sets of fractures developed mainly at the time of emplacement of the individual terrains that collided and assembled into these primary crustal units. In northern Canada, where soil and glacial cover are minimal, the shield there contains a very high density of fractures, shown in the image below.
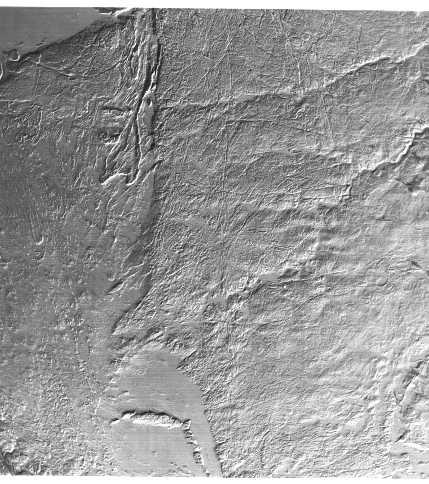
These are highlighted by two factors: 1) in this winter scene, the Sun's elevation angle is only nine degrees;, so that the low-angle rays emphasize small differences in topography associated with linear depressions, and 2) the snow cover acts as a dusting which emphasizes these features similar to sprinkling a powder on a fingerprint.
The author was part of a team at Goddard Space Flight Center that produced lineaments maps for selected areas within the Canadian Shield, which comprises most of the eastern 2/3rds of Canada. Their goal was to better understand its structural history. Because glacial scouring has removed covering soils and has sculpted lineaments into lakes, fractures over large parts of the shield are clearly evident, as demonstrated in this example.
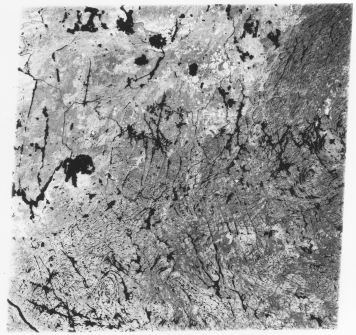
Simply by looking at the image, we can tell that the terrain in the middle of the image (below the upper-left corner) is different from the remaining terrain to the south. The terrain in the upper left corner marks the Superior Province of the Shield, consisting of meta-igneous rocks, whose ages go back beyond 2 billion years. The terrain to the right is the Grenville Province, whose rocks are generally younger and were emplaced northwestward against the Superior Province some 900 million years ago. The line, is the Grenville Front, made of thrust faults that are seen from above as a NE-trending boundary. Many of the fractures in each province stand out as linear lakes. These were glacially-scoured gouges that are now filled with water. When the orientations of the lineaments are plotted in rose diagrams for each province, two characteristics emerge:
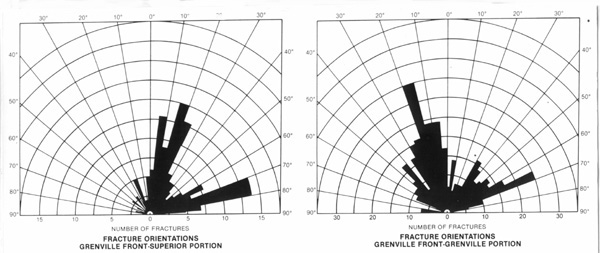
1) both provinces have a dominant ENE fracture trend and 2) the second maximum is NNE for the Superior (left diagram) and NNW for the Grenville (right diagram) Province. This example underscores the power of space imagery in providing observations that are well-suited to scientific analysis of regional structures.
2-19: There is another notable difference in the fracture distribution in the two provinces. What is it? ANSWER
Lineament analysis has a practical side, as well. For example, fractures and faults can serve as channelways for circulating solutions that eventually deposit ore minerals. They also are involved in traps for oil and gas and can be instrumental in storing and moving ground water. Original or improved lineament maps, therefore can payoff economically.
Atlanta Groundwater Survey
Our last example emphasizes this economic point. In the mid-1970s, the State Geologist of Georgia was commissioned to show where in a small area northwest of Atlanta conditions would be favorable to locate a new industrial park, which would require large amounts of groundwater for plant use. He included space imagery as a means of locating fracture patterns that could control water accumulation. The results of this effort are summarized in the sequence of image panels shown here.
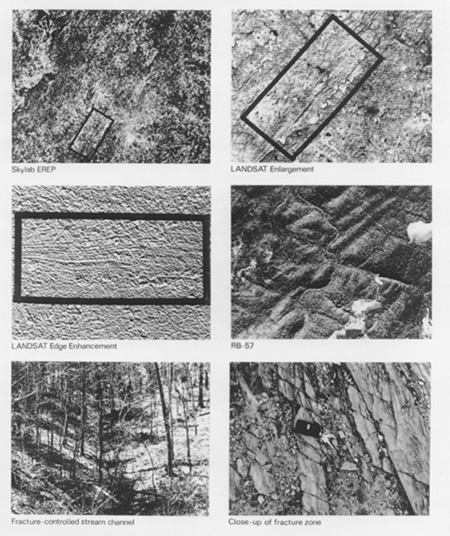
The upper left panel is a Skylab photo of Atlanta with the survey area outlined in a box. The image to its right is part of a Landsat MSS image that shows layered rock units in the Piedmont Province of the Appalachians. In the center-left image, data from Landsat were computer-processed by a technique known as edge enhancement that highlights linear features by bounding them with a light-dark contrast. The strata are out clearly visible from this technique, but also exposed are numerous parallel lines, running across the strata from upper left to lower right (almost east-west when properly reoriented). These parallel lines looked suspiciously similar to a single, prominent, joint set. When we see them in a high altitude aerial photo, taken from an RB-57 aircraft, they appear as small linear valleys (right center). When visited on the ground, they appear as joint valleys, such as in the lower left panel. When we walked out several of these joint valleys until they intersected the Interstate 285 Beltway, we found that they flowed into road cuts, where exposures such as that shown in the lower right panel, identified them as fracture zones. The porosities associated with these zones made them favorable as potential aquifers for groundwater storage.
The area was drilled and large supplies of groundwater were proven. This led to an approval for developing the industrial park. The results of this study were brought to the Governor's attention, and he was so impressed that he insisted on going into the field with the State Geologist to see the evidence. A year later that governor became President Jimmy Carter, who was always a great friend to the Landsat program. This study also was cited in Congress as prima facie evidence of the value of space technology to the nation.
2-20: What was the key step in the investigation process applied to the Atlanta survey that led to its eventual success? ANSWER
During the first ten years of Landsat, its fullest use, as measured by sales of data to the user community, was in geology. Landsat, and later SPOT and other space systems, including radar, became respected new sources of information of particular interest to those who explore for oil and gas, mineral deposits, and groundwater. We will describe remote sensing applications to resource exploration in Section 5. But first, in the next two sections we introduce two other major application regimes: in monitoring vegetation and assessing land use and urban planning .

Collaborators: Code 935 NASA GSFC, GST, USAF Academy
Contributor Information
Last Updated: September '99
Webmaster: Bill Dickinson Jr.
Site Curator: Nannette Fekete
Please direct any comments to rstweb@gst.com.